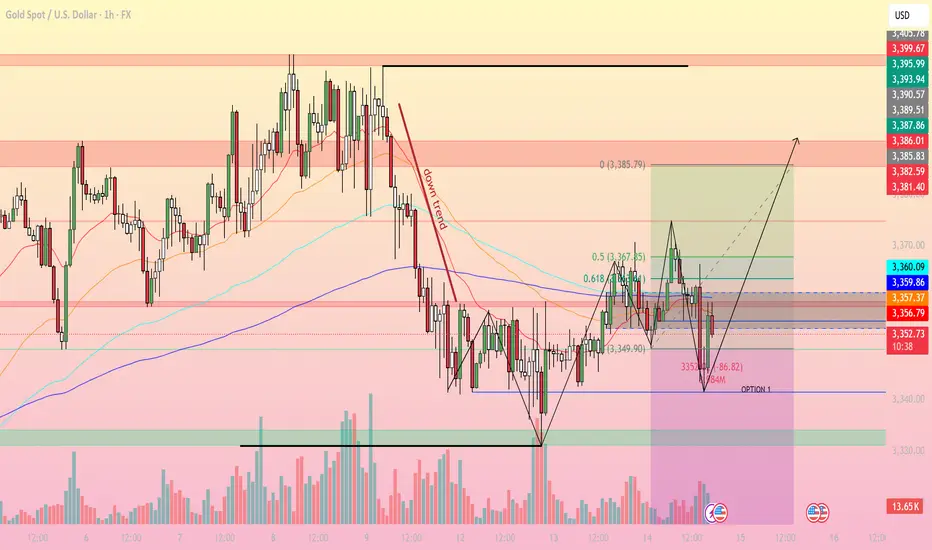
On the H1 timeframe, gold is showing signs of recovery after a sharp drop from the 3,385 zone. The short-term support area around 3,350–3,345 has been retested with a visible bullish reaction and long lower wicks.
1. Technical Analysis:
Fibonacci Retracement: Following the decline from 3,385 to 3,350, price is now trading around the 0.5–0.618 retracement zone, indicating a potential corrective wave to the upside.
EMA: EMA20 and EMA50 are still below EMA200, keeping the broader bias bearish. However, EMA20 is narrowing the gap with EMA50, suggesting a short-term bullish shift.
RSI: RSI on H1 has bounced from the oversold zone, supporting the recovery scenario.
Trendline: The main downtrend line has been slightly breached, which will turn more bullish if price closes above 3,360.
2. Key Support & Resistance Levels:
Support: 3,350 – 3,345 | 3,335
Resistance: 3,360 | 3,367 | 3,381 – 3,386 | 3,393
3. Trading Strategy Ideas:
Buy Scenario: If price holds above 3,350 and closes H1 above 3,360, consider buying with targets at 3,367 – 3,381.
Sell Scenario: If price fails to break 3,360 and drops below 3,345, expect further downside towards 3,335 – 3,330.
Risk Management: Stop loss below 3,343 for buys, above 3,370 for short-term sells.
Today’s bias leans towards a technical rebound before facing stronger selling pressure near upper resistance zones. Keep a close watch on price action around Fibonacci levels and EMA clusters to optimize entries. Follow for more high-quality trading strategies.
🪙 JOIN OUR FREE TELEGRAM GROUP 🪙
t.me/dnaprofits
Join the community group to get support and share knowledge!
️🥇 Exchange and learn market knowledge
️🥇 Support free trading signals
t.me/dnaprofits
Join the community group to get support and share knowledge!
️🥇 Exchange and learn market knowledge
️🥇 Support free trading signals
Related publications
Disclaimer
The information and publications are not meant to be, and do not constitute, financial, investment, trading, or other types of advice or recommendations supplied or endorsed by TradingView. Read more in the Terms of Use.