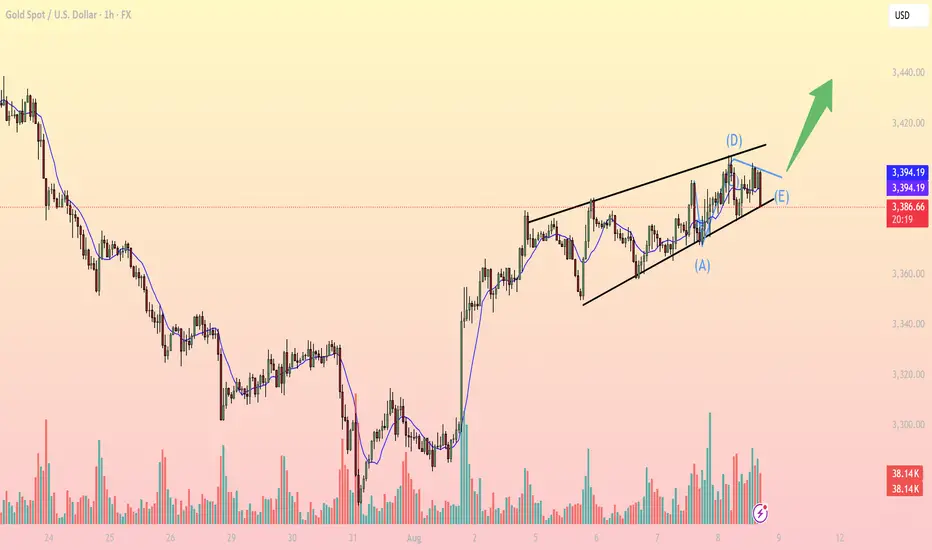
On the 1H timeframe, gold (XAUUSD) is moving within a narrow ascending channel and has recently formed a clear contracting triangle correction pattern (ABCDE). This structure suggests the market is consolidating before a potential breakout to the upside.

Detailed Analysis:
- Elliott Wave Structure:
Price action appears to have completed an ABCDE triangle, a common ending pattern before a breakout wave begins.
The conclusion of wave E implies a possible impulsive move is about to start in the direction of the prior trend – in this case, bullish.
- Trendline & Channel:
Price continues to respect a well-defined ascending channel formed since August 1st, indicating a sustained bullish structure.
The current price (3,398 USD) is nearing the upper boundary of this channel. A successful breakout could push price toward the 3,410–3,415 resistance area.
- Fibonacci Retracement:
The previous correction found solid support around the 0.618 Fibonacci level (~3,360 USD), which serves as a key buy zone if price retraces.
This area is ideal for a buy-the-dip opportunity in case of a pullback.
- EMA & RSI Indicators:
Price remains above the 50-period EMA, supporting the bullish bias.
RSI is trending above 50 and not yet in overbought territory, suggesting momentum still favors the bulls.
Key Support and Resistance Levels:
3,415 – 3,420: Major Resistance -Previous swing high, profit-taking zone
3,400 – 3,405: Minor Resistance - Channel top, potential breakout trigger
3,360 – 3,365: Key Support - Fib 0.618 zone, watch for bullish reaction
3,330
Deep Support
Strong demand zone from H4 chart
Suggested Trading Strategies:
- Strategy 1 – Breakout Buy:
Entry: On confirmed breakout above 3,405 with strong volume.
SL: Below 3,390
TP1: 3,415 | TP2: 3,420+
- Strategy 2 – Buy the Dip:
Entry: On pullback to 3,360–3,365 support zone.
SL: Below 3,350
TP: Return to 3,405–3,415 zone
- Risk Note: Price is currently near resistance – avoid chasing at the top of the channel. Only enter after breakout confirmation or wait for a retest of support for better R:R setups.
Conclusion:
Gold is showing strong potential for a bullish breakout following the completion of a classic triangle correction pattern. Focus on price action around the 3,400 level for intraday trading opportunities.
🪙 JOIN OUR FREE TELEGRAM GROUP 🪙
t.me/dnaprofits
Join the community group to get support and share knowledge!
️🥇 Exchange and learn market knowledge
️🥇 Support free trading signals
t.me/dnaprofits
Join the community group to get support and share knowledge!
️🥇 Exchange and learn market knowledge
️🥇 Support free trading signals
Related publications
Disclaimer
The information and publications are not meant to be, and do not constitute, financial, investment, trading, or other types of advice or recommendations supplied or endorsed by TradingView. Read more in the Terms of Use.