📊 Market Overview:
• Gold saw a slight correction as Middle East tensions eased following a ceasefire agreement between Iran and Israel.
• A weaker USD and lower U.S. Treasury yields offered some support to gold prices.
• However, the Fed’s cautious stance on rate cuts and upcoming testimony from Chair Powell continue to weigh on gold sentiment.
📉 Technical Analysis:
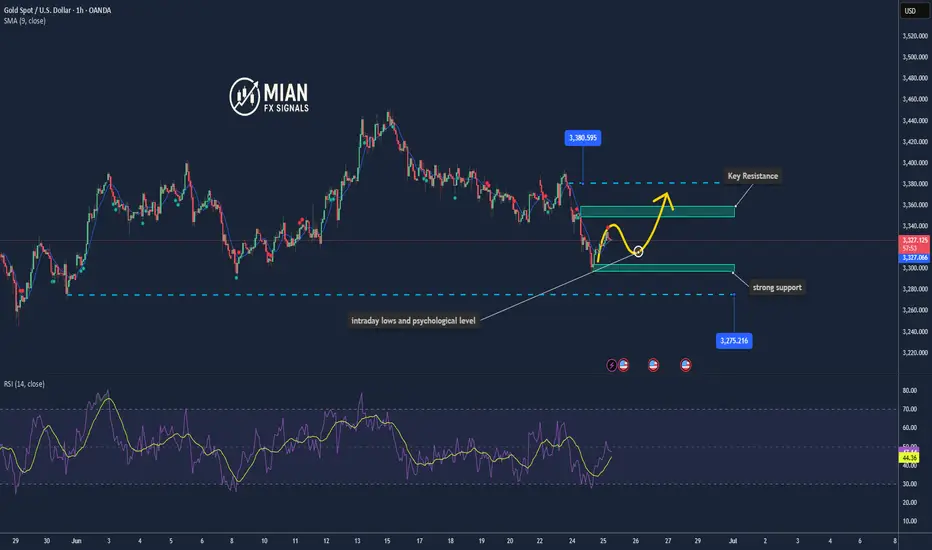
• Key Resistance Levels:
– $3,350–3,360 (21/50-day SMAs)
– $3,370–3,385 (Fibonacci zone and swing highs)
• Nearest Support Levels:
– $3,316–3,320 (intraday lows and psychological level)
– $3,300–3,305 (strong support), followed by $3,245–3,275 if broken
• EMA 09: Price is currently trading below the 09 EMA, indicating a short-term downtrend.
• Candlestick Pattern / Volume / Momentum:
– The 15-minute chart shows slight recovery signals, but with weak momentum; RSI is below average and MACD is slightly bearish.
– No strong reversal candlestick pattern detected; small-bodied candles (doji) suggest indecision and selling pressure remains near $3,340.
📌 Outlook:
Gold may decline slightly in the short term, potentially retesting the $3,316–3,320 support zone. A rebound is possible if the USD weakens further or the Fed unexpectedly signals rate cuts.
💡 Suggested Trading Plan:
🔻 SELL XAU/USD at: $3,335–3,340
🎯 TP: $3,330 - $3,325
❌ SL: $3,345
🔺 BUY XAU/USD at: $3,318 – 3,315
🎯 TP: $3,320 - $3,325
❌ SL: $3,312
• Gold saw a slight correction as Middle East tensions eased following a ceasefire agreement between Iran and Israel.
• A weaker USD and lower U.S. Treasury yields offered some support to gold prices.
• However, the Fed’s cautious stance on rate cuts and upcoming testimony from Chair Powell continue to weigh on gold sentiment.
📉 Technical Analysis:
• Key Resistance Levels:
– $3,350–3,360 (21/50-day SMAs)
– $3,370–3,385 (Fibonacci zone and swing highs)
• Nearest Support Levels:
– $3,316–3,320 (intraday lows and psychological level)
– $3,300–3,305 (strong support), followed by $3,245–3,275 if broken
• EMA 09: Price is currently trading below the 09 EMA, indicating a short-term downtrend.
• Candlestick Pattern / Volume / Momentum:
– The 15-minute chart shows slight recovery signals, but with weak momentum; RSI is below average and MACD is slightly bearish.
– No strong reversal candlestick pattern detected; small-bodied candles (doji) suggest indecision and selling pressure remains near $3,340.
📌 Outlook:
Gold may decline slightly in the short term, potentially retesting the $3,316–3,320 support zone. A rebound is possible if the USD weakens further or the Fed unexpectedly signals rate cuts.
💡 Suggested Trading Plan:
🔻 SELL XAU/USD at: $3,335–3,340
🎯 TP: $3,330 - $3,325
❌ SL: $3,345
🔺 BUY XAU/USD at: $3,318 – 3,315
🎯 TP: $3,320 - $3,325
❌ SL: $3,312
Trade active
Today, gold is moving very slowly.Trade closed: target reached
Gold has reached the sell entry point and investors have already taken profit — congratulations!📊 Forex | Gold | Crypto Market Insights & Signals
📰 Real-time news updates & expert analysis
📈 Daily Buy/Sell signals for investors
💡 Technical breakdowns & market outlooks
🔗 Join our free group: t.me/+DmS-dVFJMm40MDM9
📰 Real-time news updates & expert analysis
📈 Daily Buy/Sell signals for investors
💡 Technical breakdowns & market outlooks
🔗 Join our free group: t.me/+DmS-dVFJMm40MDM9
Related publications
Disclaimer
The information and publications are not meant to be, and do not constitute, financial, investment, trading, or other types of advice or recommendations supplied or endorsed by TradingView. Read more in the Terms of Use.
📊 Forex | Gold | Crypto Market Insights & Signals
📰 Real-time news updates & expert analysis
📈 Daily Buy/Sell signals for investors
💡 Technical breakdowns & market outlooks
🔗 Join our free group: t.me/+DmS-dVFJMm40MDM9
📰 Real-time news updates & expert analysis
📈 Daily Buy/Sell signals for investors
💡 Technical breakdowns & market outlooks
🔗 Join our free group: t.me/+DmS-dVFJMm40MDM9
Related publications
Disclaimer
The information and publications are not meant to be, and do not constitute, financial, investment, trading, or other types of advice or recommendations supplied or endorsed by TradingView. Read more in the Terms of Use.