Gold prices are currently testing the upper bound of the symmetrical triangle, providing resistance around the critical psychological level of $3,350.
The 20-day Simple Moving Average (SMA) is holding near $3,295, just below the $3,300 psychological level.
A 2% price increase in today’s session so far has allowed prices to adopt a bullish tone, reflected by an uptick in the Relative Strength Index (RSI), which has risen to 57.
For the next significant move, a clear break of trendline resistance could see prices retest the May high near $3,431, potentially opening the door for a retest of the April 22 all-time high of $3,500.
If prices fail to remain upbeat, a move below $3,300 could see Gold prices move back toward the 23.6% Fibonacci retracement level of the January-April move, near $3,291, and toward the 38.6% Fibonacci level of that same move at $3,161.
Trade active
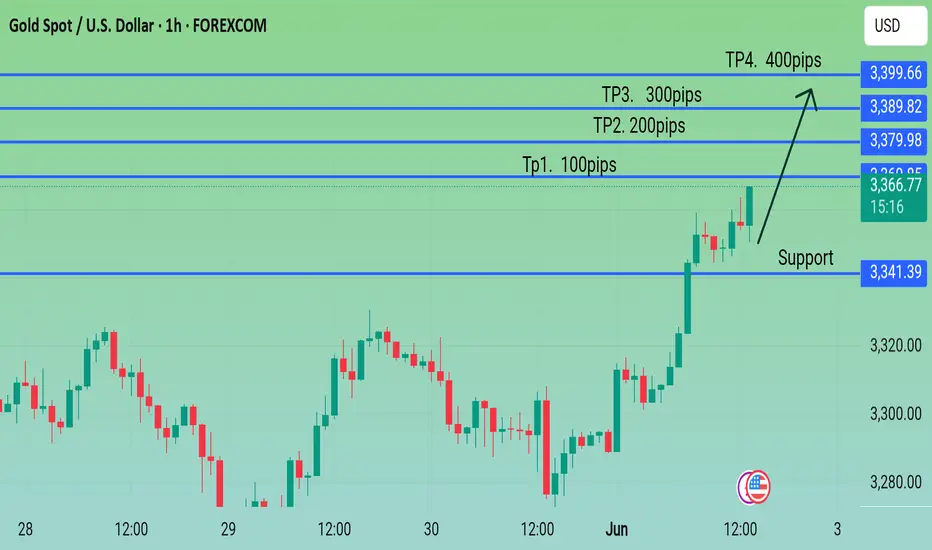
Gold buy. Tp1. 100pips. Confirm. 50pips running profit Note
Gold buy. TP2. 200pips Hit Trade closed: target reached
Gold price is bullishly biased as buyers lifted the XAU/USD spot price above $3,370, eyeing a clear break of the $3,400 level. The Relative Strength Index (RSI) indicates that buyers are gaining momentum.Note
From a technical perspective, the overnight breakout through the $3,324-3,326 hurdle and a subsequent strength beyond the $3,355 area was seen as a key trigger for the XAU/USD bulls. Moreover, oscillators on daily/hourly charts are holding comfortably in positive territory and suggest that the path of least resistance for the Gold price is to the upside. Hence, any subsequent slide below the $3,355 area could be seen as a buying opportunity and remain limited near the $3,326-3,324 resistance-turned-support. Some follow-through selling, however, could make the commodity vulnerable to weakening further below the $3,300 mark and testing the $3,286-3,285 horizontal support.Note
On the flip side, bulls might now wait for a move beyond the $3,400 round figure before positioning for a move toward the next relevant resistance near the $3,430-3,432 area. A sustained strength beyond the latter should allow the Gold price to retest the all-time peak touched in April and make a fresh attempt to conquer the $3,500 psychological mark.Disclaimer
The information and publications are not meant to be, and do not constitute, financial, investment, trading, or other types of advice or recommendations supplied or endorsed by TradingView. Read more in the Terms of Use.
Disclaimer
The information and publications are not meant to be, and do not constitute, financial, investment, trading, or other types of advice or recommendations supplied or endorsed by TradingView. Read more in the Terms of Use.