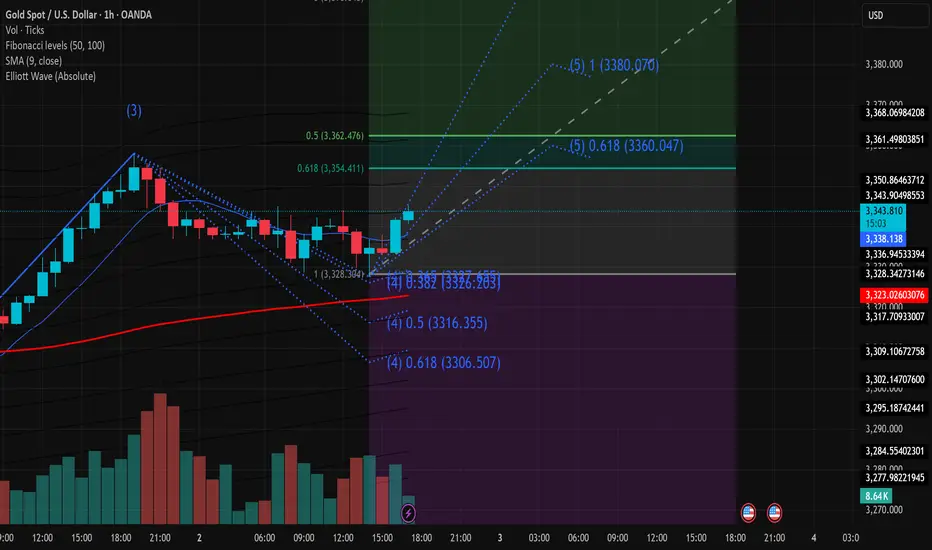
On the 1-hour chart, Gold (XAUUSD) has just confirmed the completion of corrective wave (4) around the 3,328.3 zone, which aligns with the 1.0 Fibonacci level and EMA9 support. Currently, price is rebounding with increasing volume, signaling that buying momentum is returning.

Key Technical Highlights:
Elliott Wave Structure:
Wave (4) found support at 3,328.3.
Wave (5) targets are forming, with Fibonacci extensions pointing to:
0.618: 3,360.05
1.0: 3,380.07
=> These are critical resistance zones to watch.
Fibonacci Retracement Zones:
The current rebound is heading toward the 0.5 and 0.618 retracement levels of the previous down leg, located at 3,362.4 and 3,354.4 – short-term upside targets.
Volume Analysis:
Rising volume on bullish candles confirms a legitimate buying interest, supporting the upward movement.
EMA9 Breakout:
Price has broken above the EMA9 at 3,338.2, shifting short-term trend bias to bullish.
Suggested Trading Strategy:
Favor Buy on Dip entries near the 3,340–3,342 zone if a minor pullback occurs.
Short-term targets: 3,354 – 3,362
Extended target: 3,380
Suggested stop loss below 3,328.0 to manage risk.
Conclusion:
A bullish impulse is forming following the end of wave (4). If price holds above 3,340 and breaks through the nearby Fibonacci resistance levels, wave (5) could extend towards the 3,380 area. This is a pivotal moment to watch for a confirmed short-term uptrend.
Trade active
There will be many unexpected developments in the upcoming trading session — let’s stay updated together!🪙 JOIN OUR FREE TELEGRAM GROUP 🪙
t.me/dnaprofits
Join the community group to get support and share knowledge!
️🥇 Exchange and learn market knowledge
️🥇 Support free trading signals
t.me/dnaprofits
Join the community group to get support and share knowledge!
️🥇 Exchange and learn market knowledge
️🥇 Support free trading signals
Related publications
Disclaimer
The information and publications are not meant to be, and do not constitute, financial, investment, trading, or other types of advice or recommendations supplied or endorsed by TradingView. Read more in the Terms of Use.
🪙 JOIN OUR FREE TELEGRAM GROUP 🪙
t.me/dnaprofits
Join the community group to get support and share knowledge!
️🥇 Exchange and learn market knowledge
️🥇 Support free trading signals
t.me/dnaprofits
Join the community group to get support and share knowledge!
️🥇 Exchange and learn market knowledge
️🥇 Support free trading signals
Related publications
Disclaimer
The information and publications are not meant to be, and do not constitute, financial, investment, trading, or other types of advice or recommendations supplied or endorsed by TradingView. Read more in the Terms of Use.