Gold Trade Roadmap for Tomorrow (XAU/USD)
This strategy is optimized for use with Heikin Ashi candlesticks due to their ability to smooth out market noise and provide clearer trend identification compared to standard candlestick charts. Heikin Ashi allows for more reliable signals when paired with the EMA5 cross and lock approach, making it easier to spot trend continuations and reversals. This smoother trend analysis helps minimize false signals, especially in volatile markets like XAU/USD (Gold vs. USD)
------
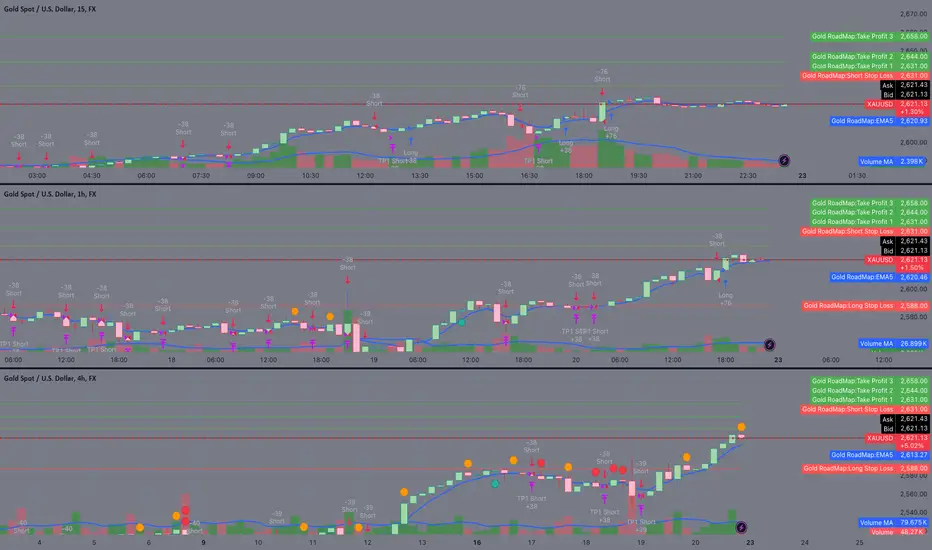
Based on the 1H and 4H analysis provided, here is a step-by-step strategy to follow for tomorrow. This roadmap includes both long and short positions, taking into account potential price movements and key technical levels.
1. Long Position Setup (Bullish Bias)
Primary Plan: Buy on dips and target key resistance levels, riding the bullish momentum.
• Entry Points:
• Primary Entry: Around 2618 (current Goldturn support). This level offers a good dip-buying opportunity as it aligns with the broader bullish trend.
• Alternate Entry: If there is a deeper pullback, look to enter around 2603, which is within the retracement range.
• Stop Loss (SL):
• Below 2603: A break below this level may invalidate the long setup and signal further downside.
• More Conservative SL: Below 2588, giving more room for fluctuations without stopping out too early.
• Take Profit (TP):
• TP1: 2631 (immediate resistance). If the price reaches this level, it’s a good opportunity to take partial profit.
• TP2: 2644 (next resistance). If 2631 is breached with an EMA5 cross and lock, expect a continuation to this level.
• TP3: 2658 (stronger resistance). Momentum beyond 2644 may take the price here.
• TP4: 2682 (extended bullish target).
• TP5: 2699 (an ambitious, longer-term bullish target).
Bullish Scenario:
• If the price holds above 2618, aim for 2631 as the first target. If EMA5 crosses and locks above 2631, look for a further move towards 2644 and beyond.
2. Short Position Setup (Bearish Bias)
Primary Plan: Sell on rejections at resistance or break of support levels, targeting retracements.
• Entry Points:
• Primary Entry: Short the market below 2618 if an EMA5 cross and lock confirms the breakdown of this support level.
• Alternate Entry: If the price reaches 2631 but shows rejection, consider entering a short position at this level, as it may act as a strong resistance zone.
• Stop Loss (SL):
• Above 2631: Place SL above this key resistance if the price breaks above, which would invalidate the short trade.
• More Aggressive SL: For entry at 2603, place SL just above 2618.
• Take Profit (TP):
• TP1: 2603 (retracement target). The first level where the price might pause.
• TP2: 2588 (deeper retracement target).
• TP3: 2575 (swing range support).
• TP4: 2558 (key swing range target).
• TP5: 2542 (extended bearish target if selling pressure continues).
Bearish Scenario:
• If the price breaks below 2618, expect it to test 2603 first, followed by 2588. If momentum continues, the next levels are 2575 and 2558.
Trading Plan for Tomorrow
Long Position Strategy:
1. Entry: Look for long entries around 2618 or at 2603 on a deeper retracement.
2. Stop Loss: Place SL below 2603 (or below 2588 for a safer setup).
3. Targets: Start taking profits at 2631, and then aim for 2644, 2658, 2682, and 2699 if momentum is sustained.
Short Position Strategy:
1. Entry: Look for short entries below 2618 or if price shows rejection at 2631.
2. Stop Loss: Place SL above 2631 or tighter above 2618 if you enter at 2603.
3. Targets: Take profits first at 2603, and then aim for 2588, 2575, 2558, and 2542.
Daily and 4H Outlook for Tomorrow
Scenario 1: Bullish Break Above 2631:
• A confirmed EMA5 cross and lock above 2631 will trigger long entries targeting 2644 and potentially 2658 and 2682. Monitor the price closely at 2631 for breakout strength.
Scenario 2: Bearish Break Below 2618:
• If price breaks below 2618, it may head towards 2603 and 2588. Watch for an EMA5 cross below 2603, which would strengthen the bearish move.
Key Levels for Tomorrow
• Resistance: 2631 (immediate), 2644, 2658 (major targets).
• Support: 2618 (current), 2603, 2588 (retracement and swing levels).
This roadmap will help guide your trading decisions tomorrow, with clear levels and plans for both long and short positions.
Using a 5-minute chart with Heikin Ashi candlesticks can be a powerful combination, particularly for scalping or short-term trend trading in volatile markets like XAU/USD (Gold vs. USD). Let’s break down how and why you might use this setup:
Why Use a 5-Minute Chart?
• Timeframe: The 5-minute chart is ideal for short-term trading or scalping strategies. It provides fast updates and captures more detailed price movements, which are necessary for taking advantage of quick market swings.
• Intraday Trading: This timeframe allows you to enter and exit trades multiple times during the day, capitalizing on quick fluctuations around key levels like 2618, 2631, and others mentioned in the strategy above.
• Precision in Entries/Exits: Short-term charts like the 5-minute are useful for fine-tuning your entry and exit points around key support/resistance levels (e.g., 2618 for long entries or 2631 for short entries).
Why Use Heikin Ashi Candlesticks?
• Smoother Trend Identification: Heikin Ashi candlesticks are great for filtering out noise from the market and identifying smoother trends. This is especially useful in choppy markets like gold, where typical candlestick patterns can be misleading due to volatility.
• Trend Continuation: Heikin Ashi makes it easier to spot trend continuations and reversals. For example:
• Bullish Trend: A series of green Heikin Ashi candles with little or no lower shadows indicates strong upward momentum, supporting long entries.
• Bearish Trend: A series of red Heikin Ashi candles with little or no upper shadows indicates strong downward momentum, supporting short entries.
• Reduced False Signals: Since Heikin Ashi smooths out market fluctuations, it helps reduce the number of false signals during volatile conditions, making it easier to follow your strategy.
Best Usage of the 5-Minute Heikin Ashi Chart:
1. Entry Timing: Use Heikin Ashi candlesticks on the 5-minute chart to time your entries based on the trend direction. Wait for the Heikin Ashi candles to confirm a trend before entering.
• For a long position, wait until you see consecutive green Heikin Ashi candles and minimal lower shadows, ideally after bouncing off a support level like 2618 or 2603.
• For a short position, wait until you see consecutive red Heikin Ashi candles with minimal upper shadows, especially after rejection from a resistance level like 2631.
2. Trend Confirmation: After identifying a trend on the 1-hour or 4-hour chart, you can use the 5-minute Heikin Ashi chart to confirm entries in line with the overall trend. For instance:
• If the 1-hour or 4-hour chart shows a bullish bias, wait for a trend change on the 5-minute Heikin Ashi chart to enter a long position.
• If the higher timeframe suggests a bearish reversal, use the 5-minute chart for short entries when the Heikin Ashi candles turn red.
3. EMA5 Confirmation: Combine the Heikin Ashi 5-minute chart with your EMA5 cross and lock strategy. Use the Heikin Ashi candles to confirm trend direction, and enter once you see an EMA5 cross on the 5-minute chart that aligns with the Heikin Ashi trend.
• Bullish Example: Green Heikin Ashi candles + EMA5 cross above a key level (e.g., 2618) = enter long.
• Bearish Example: Red Heikin Ashi candles + EMA5 cross below a key level (e.g., 2603) = enter short.
4. Exit Signals: Heikin Ashi also helps in determining when to exit a position. Look for Heikin Ashi candles to change color or show long wicks in the opposite direction (indicating a potential trend reversal).
• In a long trade, if green Heikin Ashi candles start showing upper shadows or turn red, this could be a sign to exit.
• In a short trade, if red Heikin Ashi candles develop lower shadows or turn green, this may indicate it’s time to close your position.
Disclaimer:
Trading financial instruments such as XAU/USD involves significant risk and may not be suitable for all investors. The information provided in this strategy is for educational purposes only and should not be considered as financial advice. Past performance is not indicative of future results. Always do your own research or consult with a licensed financial advisor before making any trading decisions. The use of Heikin Ashi or any other technical analysis tool does not guarantee profitable results, and losses may occur.
This strategy is optimized for use with Heikin Ashi candlesticks due to their ability to smooth out market noise and provide clearer trend identification compared to standard candlestick charts. Heikin Ashi allows for more reliable signals when paired with the EMA5 cross and lock approach, making it easier to spot trend continuations and reversals. This smoother trend analysis helps minimize false signals, especially in volatile markets like XAU/USD (Gold vs. USD)
------
Based on the 1H and 4H analysis provided, here is a step-by-step strategy to follow for tomorrow. This roadmap includes both long and short positions, taking into account potential price movements and key technical levels.
1. Long Position Setup (Bullish Bias)
Primary Plan: Buy on dips and target key resistance levels, riding the bullish momentum.
• Entry Points:
• Primary Entry: Around 2618 (current Goldturn support). This level offers a good dip-buying opportunity as it aligns with the broader bullish trend.
• Alternate Entry: If there is a deeper pullback, look to enter around 2603, which is within the retracement range.
• Stop Loss (SL):
• Below 2603: A break below this level may invalidate the long setup and signal further downside.
• More Conservative SL: Below 2588, giving more room for fluctuations without stopping out too early.
• Take Profit (TP):
• TP1: 2631 (immediate resistance). If the price reaches this level, it’s a good opportunity to take partial profit.
• TP2: 2644 (next resistance). If 2631 is breached with an EMA5 cross and lock, expect a continuation to this level.
• TP3: 2658 (stronger resistance). Momentum beyond 2644 may take the price here.
• TP4: 2682 (extended bullish target).
• TP5: 2699 (an ambitious, longer-term bullish target).
Bullish Scenario:
• If the price holds above 2618, aim for 2631 as the first target. If EMA5 crosses and locks above 2631, look for a further move towards 2644 and beyond.
2. Short Position Setup (Bearish Bias)
Primary Plan: Sell on rejections at resistance or break of support levels, targeting retracements.
• Entry Points:
• Primary Entry: Short the market below 2618 if an EMA5 cross and lock confirms the breakdown of this support level.
• Alternate Entry: If the price reaches 2631 but shows rejection, consider entering a short position at this level, as it may act as a strong resistance zone.
• Stop Loss (SL):
• Above 2631: Place SL above this key resistance if the price breaks above, which would invalidate the short trade.
• More Aggressive SL: For entry at 2603, place SL just above 2618.
• Take Profit (TP):
• TP1: 2603 (retracement target). The first level where the price might pause.
• TP2: 2588 (deeper retracement target).
• TP3: 2575 (swing range support).
• TP4: 2558 (key swing range target).
• TP5: 2542 (extended bearish target if selling pressure continues).
Bearish Scenario:
• If the price breaks below 2618, expect it to test 2603 first, followed by 2588. If momentum continues, the next levels are 2575 and 2558.
Trading Plan for Tomorrow
Long Position Strategy:
1. Entry: Look for long entries around 2618 or at 2603 on a deeper retracement.
2. Stop Loss: Place SL below 2603 (or below 2588 for a safer setup).
3. Targets: Start taking profits at 2631, and then aim for 2644, 2658, 2682, and 2699 if momentum is sustained.
Short Position Strategy:
1. Entry: Look for short entries below 2618 or if price shows rejection at 2631.
2. Stop Loss: Place SL above 2631 or tighter above 2618 if you enter at 2603.
3. Targets: Take profits first at 2603, and then aim for 2588, 2575, 2558, and 2542.
Daily and 4H Outlook for Tomorrow
Scenario 1: Bullish Break Above 2631:
• A confirmed EMA5 cross and lock above 2631 will trigger long entries targeting 2644 and potentially 2658 and 2682. Monitor the price closely at 2631 for breakout strength.
Scenario 2: Bearish Break Below 2618:
• If price breaks below 2618, it may head towards 2603 and 2588. Watch for an EMA5 cross below 2603, which would strengthen the bearish move.
Key Levels for Tomorrow
• Resistance: 2631 (immediate), 2644, 2658 (major targets).
• Support: 2618 (current), 2603, 2588 (retracement and swing levels).
This roadmap will help guide your trading decisions tomorrow, with clear levels and plans for both long and short positions.
Using a 5-minute chart with Heikin Ashi candlesticks can be a powerful combination, particularly for scalping or short-term trend trading in volatile markets like XAU/USD (Gold vs. USD). Let’s break down how and why you might use this setup:
Why Use a 5-Minute Chart?
• Timeframe: The 5-minute chart is ideal for short-term trading or scalping strategies. It provides fast updates and captures more detailed price movements, which are necessary for taking advantage of quick market swings.
• Intraday Trading: This timeframe allows you to enter and exit trades multiple times during the day, capitalizing on quick fluctuations around key levels like 2618, 2631, and others mentioned in the strategy above.
• Precision in Entries/Exits: Short-term charts like the 5-minute are useful for fine-tuning your entry and exit points around key support/resistance levels (e.g., 2618 for long entries or 2631 for short entries).
Why Use Heikin Ashi Candlesticks?
• Smoother Trend Identification: Heikin Ashi candlesticks are great for filtering out noise from the market and identifying smoother trends. This is especially useful in choppy markets like gold, where typical candlestick patterns can be misleading due to volatility.
• Trend Continuation: Heikin Ashi makes it easier to spot trend continuations and reversals. For example:
• Bullish Trend: A series of green Heikin Ashi candles with little or no lower shadows indicates strong upward momentum, supporting long entries.
• Bearish Trend: A series of red Heikin Ashi candles with little or no upper shadows indicates strong downward momentum, supporting short entries.
• Reduced False Signals: Since Heikin Ashi smooths out market fluctuations, it helps reduce the number of false signals during volatile conditions, making it easier to follow your strategy.
Best Usage of the 5-Minute Heikin Ashi Chart:
1. Entry Timing: Use Heikin Ashi candlesticks on the 5-minute chart to time your entries based on the trend direction. Wait for the Heikin Ashi candles to confirm a trend before entering.
• For a long position, wait until you see consecutive green Heikin Ashi candles and minimal lower shadows, ideally after bouncing off a support level like 2618 or 2603.
• For a short position, wait until you see consecutive red Heikin Ashi candles with minimal upper shadows, especially after rejection from a resistance level like 2631.
2. Trend Confirmation: After identifying a trend on the 1-hour or 4-hour chart, you can use the 5-minute Heikin Ashi chart to confirm entries in line with the overall trend. For instance:
• If the 1-hour or 4-hour chart shows a bullish bias, wait for a trend change on the 5-minute Heikin Ashi chart to enter a long position.
• If the higher timeframe suggests a bearish reversal, use the 5-minute chart for short entries when the Heikin Ashi candles turn red.
3. EMA5 Confirmation: Combine the Heikin Ashi 5-minute chart with your EMA5 cross and lock strategy. Use the Heikin Ashi candles to confirm trend direction, and enter once you see an EMA5 cross on the 5-minute chart that aligns with the Heikin Ashi trend.
• Bullish Example: Green Heikin Ashi candles + EMA5 cross above a key level (e.g., 2618) = enter long.
• Bearish Example: Red Heikin Ashi candles + EMA5 cross below a key level (e.g., 2603) = enter short.
4. Exit Signals: Heikin Ashi also helps in determining when to exit a position. Look for Heikin Ashi candles to change color or show long wicks in the opposite direction (indicating a potential trend reversal).
• In a long trade, if green Heikin Ashi candles start showing upper shadows or turn red, this could be a sign to exit.
• In a short trade, if red Heikin Ashi candles develop lower shadows or turn green, this may indicate it’s time to close your position.
Disclaimer:
Trading financial instruments such as XAU/USD involves significant risk and may not be suitable for all investors. The information provided in this strategy is for educational purposes only and should not be considered as financial advice. Past performance is not indicative of future results. Always do your own research or consult with a licensed financial advisor before making any trading decisions. The use of Heikin Ashi or any other technical analysis tool does not guarantee profitable results, and losses may occur.
لو عايز تبقى واحد من اللي بيفهموا في الدهب وبيكسبوا من السوق صح،
🎯 للدهب والفرص الحقيقية تابعنا من هنا:
For gold updates & smart trades 👇
t.me/GOLDontheNILE
You're welcome to join my Telegram channel
انضم وابقى من اللعيبة مش من الجمهور💰🔥
🎯 للدهب والفرص الحقيقية تابعنا من هنا:
For gold updates & smart trades 👇
t.me/GOLDontheNILE
You're welcome to join my Telegram channel
انضم وابقى من اللعيبة مش من الجمهور💰🔥
Disclaimer
The information and publications are not meant to be, and do not constitute, financial, investment, trading, or other types of advice or recommendations supplied or endorsed by TradingView. Read more in the Terms of Use.