Market news:
On Friday (July 25), London gold prices fell for two consecutive days under the dual pressure of global trade optimism and strong economic data. During the session, it once approached the psychological mark of US$3,350/ounce. The spot gold price fell sharply again, reflecting the easing of global trade tensions and the demand for safe-haven assets. The US dollar and US Treasury yields rose, which also hit the gold trend. In addition, rising stock markets and low volatility suppressed the upward momentum of international gold. The unexpected improvement in US labor market data further pushed up the US dollar and US Treasury yields, and the international market brought significant downward pressure on gold prices. At the same time, President Trump’s rare visit to the Federal Reserve and the market’s close attention to the Federal Reserve’s interest rate policy have added more uncertainty to the gold market. Looking ahead, the market’s attention is turning to the upcoming US durable goods orders data. As an important indicator of manufacturing activity and economic health, durable goods orders data may provide new clues to the trend of gold prices. Investors need to pay close attention to two key time points: one is the subtle changes in the Fed’s inflation statement at the July 30 interest rate meeting; the other is the final details of the US-EU agreement before the August 1 tariff deadline.
Technical review:
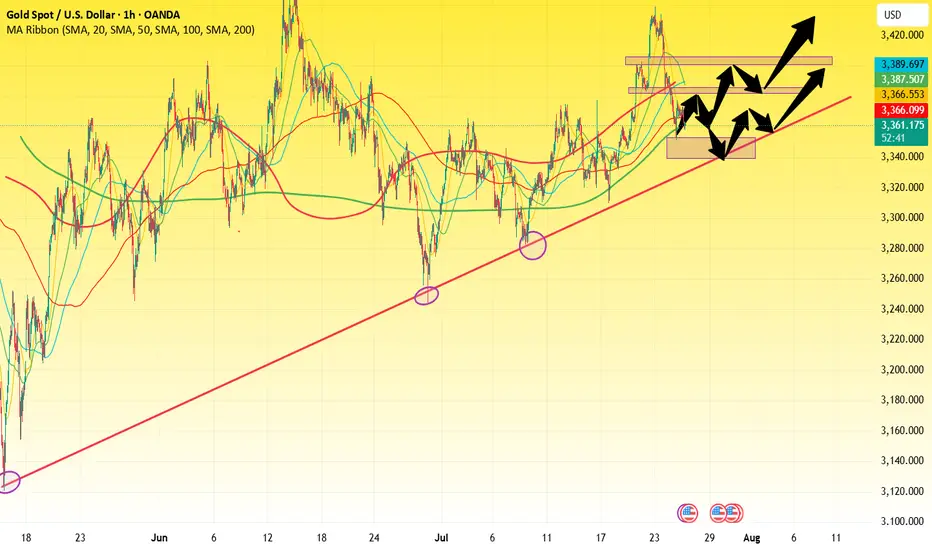
From the daily chart of gold, after three consecutive positive days, the price of gold fell under pressure. The daily K-line closed negatively. From the technical indicators, the MA5-MA10 moving averages and MACD formed a golden cross, but the red kinetic energy column gradually shortened, which means that the bulls lacked stamina. KDJ crossed downward in the middle position, indicating that the upward momentum was exhausted, which was a weak signal in the short term!
Technical aspects:the daily chart of gold adjusted and repaired, and the MA10 daily moving average was 3365. In the early morning, it formed a bottoming out and rebounded, stopping at the 3351/50 mark, and then pulled up above 3377. The MA10/7-day moving average continued to open upward, and the RSI stopped above the middle axis. In the short-term four-hour chart and hourly chart, the gold price is in the middle and lower track of the Bollinger band channel, and the moving average is glued. On Friday, the idea of shocks is to sell high and buy low for short-term participation. Pay attention to the 3352/3392 range during the day!
Today's analysis:
Gold continued to fall yesterday. Our friend circle of the US market 3377 prompted direct shorting and fell as expected. Although there was a rebound, the rebound of gold was just to repair the market. The selling of gold has not ended yet. The rebound is an opportunity to continue selling. Sell directly above 3370 during the day!The 1-hour moving average of gold continues to turn downward. If a dead cross is formed, the downward space of gold will be further opened. Gold will still have room to fall. Gold rebounded in the US market yesterday and still faced the resistance of 3377. It continued to go short at highs after rebounding below 3377 in the Asian market. If it cannot even reach 3377 today, it will be a weak rebound, and gold selling will be more like a fish in water.
Operation ideas:
Buy short-term gold at 3345-3348, stop loss at 3337, target at 3370-3390;
Sell short-term gold at 3374-3377, stop loss at 3386, target at 3350-3330;
Key points:
First support level: 3350, second support level: 3342, third support level: 3323
First resistance level: 3375, second resistance level: 3390, third resistance level: 3406
On Friday (July 25), London gold prices fell for two consecutive days under the dual pressure of global trade optimism and strong economic data. During the session, it once approached the psychological mark of US$3,350/ounce. The spot gold price fell sharply again, reflecting the easing of global trade tensions and the demand for safe-haven assets. The US dollar and US Treasury yields rose, which also hit the gold trend. In addition, rising stock markets and low volatility suppressed the upward momentum of international gold. The unexpected improvement in US labor market data further pushed up the US dollar and US Treasury yields, and the international market brought significant downward pressure on gold prices. At the same time, President Trump’s rare visit to the Federal Reserve and the market’s close attention to the Federal Reserve’s interest rate policy have added more uncertainty to the gold market. Looking ahead, the market’s attention is turning to the upcoming US durable goods orders data. As an important indicator of manufacturing activity and economic health, durable goods orders data may provide new clues to the trend of gold prices. Investors need to pay close attention to two key time points: one is the subtle changes in the Fed’s inflation statement at the July 30 interest rate meeting; the other is the final details of the US-EU agreement before the August 1 tariff deadline.
Technical review:
From the daily chart of gold, after three consecutive positive days, the price of gold fell under pressure. The daily K-line closed negatively. From the technical indicators, the MA5-MA10 moving averages and MACD formed a golden cross, but the red kinetic energy column gradually shortened, which means that the bulls lacked stamina. KDJ crossed downward in the middle position, indicating that the upward momentum was exhausted, which was a weak signal in the short term!
Technical aspects:the daily chart of gold adjusted and repaired, and the MA10 daily moving average was 3365. In the early morning, it formed a bottoming out and rebounded, stopping at the 3351/50 mark, and then pulled up above 3377. The MA10/7-day moving average continued to open upward, and the RSI stopped above the middle axis. In the short-term four-hour chart and hourly chart, the gold price is in the middle and lower track of the Bollinger band channel, and the moving average is glued. On Friday, the idea of shocks is to sell high and buy low for short-term participation. Pay attention to the 3352/3392 range during the day!
Today's analysis:
Gold continued to fall yesterday. Our friend circle of the US market 3377 prompted direct shorting and fell as expected. Although there was a rebound, the rebound of gold was just to repair the market. The selling of gold has not ended yet. The rebound is an opportunity to continue selling. Sell directly above 3370 during the day!The 1-hour moving average of gold continues to turn downward. If a dead cross is formed, the downward space of gold will be further opened. Gold will still have room to fall. Gold rebounded in the US market yesterday and still faced the resistance of 3377. It continued to go short at highs after rebounding below 3377 in the Asian market. If it cannot even reach 3377 today, it will be a weak rebound, and gold selling will be more like a fish in water.
Operation ideas:
Buy short-term gold at 3345-3348, stop loss at 3337, target at 3370-3390;
Sell short-term gold at 3374-3377, stop loss at 3386, target at 3350-3330;
Key points:
First support level: 3350, second support level: 3342, third support level: 3323
First resistance level: 3375, second resistance level: 3390, third resistance level: 3406
Good trading signals can help you make profits in the market. I will share trading signal analysis of various products every day, hoping to help you!
t.me/+WHE58rEaywExNWVh
t.me/+WHE58rEaywExNWVh
Disclaimer
The information and publications are not meant to be, and do not constitute, financial, investment, trading, or other types of advice or recommendations supplied or endorsed by TradingView. Read more in the Terms of Use.