XAUUSD – Gold Price Analysis for August 11, 2025: Buying Opportunity from Key Support Zone
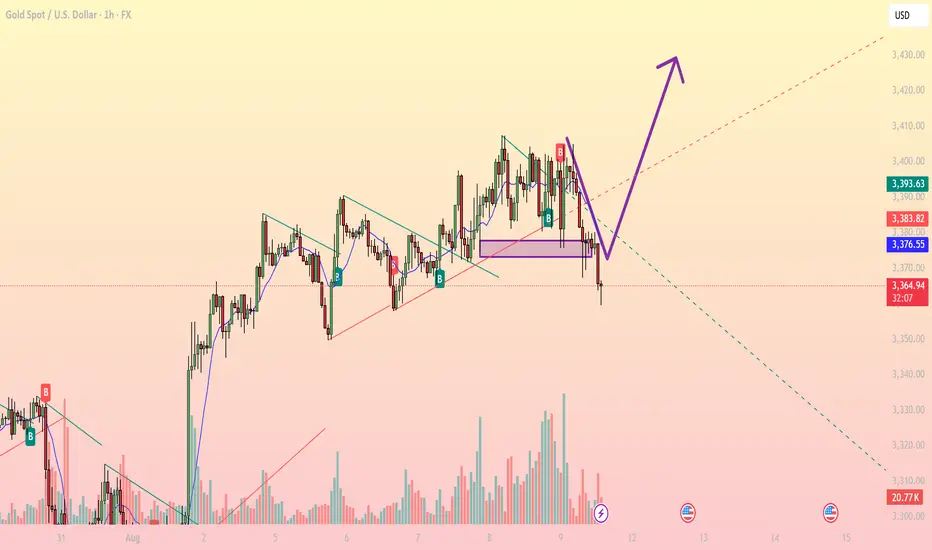
In today’s session, gold (XAUUSD) on the H1 timeframe is pulling back after breaking the short-term support zone at 3,376 – 3,378 and moving down towards 3,356 – 3,358 – which aligns with the 0.618 Fibonacci retracement of the previous bullish swing. This is a key support area where buyers may step in if the market reacts positively.

1. Technical Analysis
EMA: Price is trading below the short-term EMA, showing sellers in control, but the gap is small, leaving room for a potential rebound.
Fibonacci: The 0.618 level around 3,356 acts as a technical pivot and strong support.
RSI: Approaching oversold territory, signaling a possible technical bounce.
Trendline: Price is testing the medium-term ascending trendline from late July. Holding this level would strengthen the bullish outlook.
2. Key Price Levels
Near-term Resistance: 3,376 – 3,378
Major Resistance: 3,383 – 3,384 and 3,393 – 3,395
Near-term Support: 3,356 – 3,358
Major Support: 3,340
3. Trading Strategies
Primary Scenario: Buy around 3,356 – 3,358, stop loss below 3,348, take profit at 3,376 – 3,378, extended targets at 3,383 – 3,393.
Alternative Scenario: If price breaks below 3,348 with strong volume, consider selling towards 3,340 – 3,328.
Today’s bias remains buying at support – taking profit at resistance. Traders should closely monitor price action at these levels to optimize entries.
Follow for more actionable gold trading strategies in the upcoming sessions.
In today’s session, gold (XAUUSD) on the H1 timeframe is pulling back after breaking the short-term support zone at 3,376 – 3,378 and moving down towards 3,356 – 3,358 – which aligns with the 0.618 Fibonacci retracement of the previous bullish swing. This is a key support area where buyers may step in if the market reacts positively.
1. Technical Analysis
EMA: Price is trading below the short-term EMA, showing sellers in control, but the gap is small, leaving room for a potential rebound.
Fibonacci: The 0.618 level around 3,356 acts as a technical pivot and strong support.
RSI: Approaching oversold territory, signaling a possible technical bounce.
Trendline: Price is testing the medium-term ascending trendline from late July. Holding this level would strengthen the bullish outlook.
2. Key Price Levels
Near-term Resistance: 3,376 – 3,378
Major Resistance: 3,383 – 3,384 and 3,393 – 3,395
Near-term Support: 3,356 – 3,358
Major Support: 3,340
3. Trading Strategies
Primary Scenario: Buy around 3,356 – 3,358, stop loss below 3,348, take profit at 3,376 – 3,378, extended targets at 3,383 – 3,393.
Alternative Scenario: If price breaks below 3,348 with strong volume, consider selling towards 3,340 – 3,328.
Today’s bias remains buying at support – taking profit at resistance. Traders should closely monitor price action at these levels to optimize entries.
Follow for more actionable gold trading strategies in the upcoming sessions.
🪙 JOIN OUR FREE TELEGRAM GROUP 🪙
t.me/dnaprofits
Join the community group to get support and share knowledge!
️🥇 Exchange and learn market knowledge
️🥇 Support free trading signals
t.me/dnaprofits
Join the community group to get support and share knowledge!
️🥇 Exchange and learn market knowledge
️🥇 Support free trading signals
Related publications
Disclaimer
The information and publications are not meant to be, and do not constitute, financial, investment, trading, or other types of advice or recommendations supplied or endorsed by TradingView. Read more in the Terms of Use.