1. Trend & Price Structure
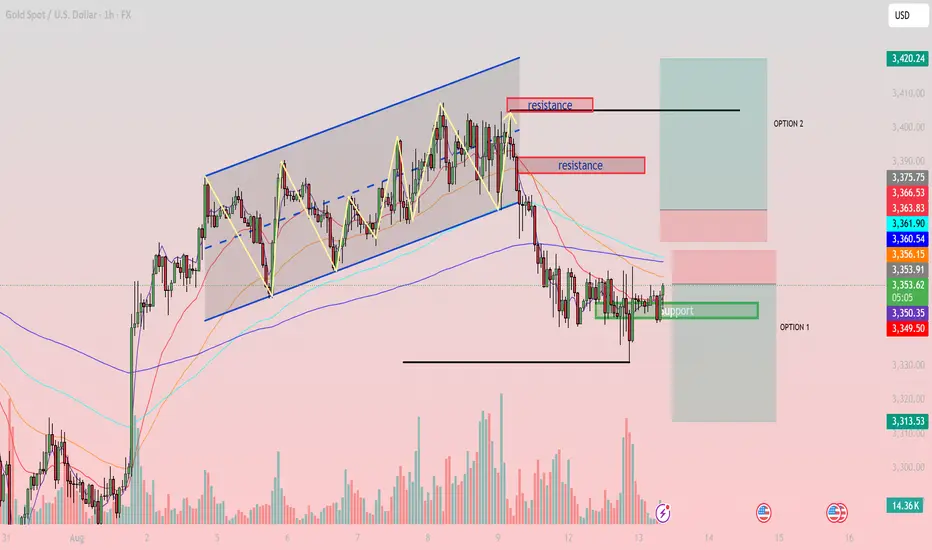
Previously, gold moved within an ascending channel but broke down on Aug 9, accompanied by strong selling pressure.
The price is now consolidating sideways around the 3,350 – 3,351 support zone (Option 1), with decreasing volume.
Short-term EMAs (EMA20, EMA50) are still below EMA200, indicating the short-term trend remains bearish.

2. Key Support & Resistance Levels
Immediate Support: 3,350 – 3,351 (a breakdown could send the price toward 3,325).
Near-term Resistance: 3,360 – 3,361 (aligned with EMA50 on H1).
Major Resistance: 3,375 – 3,380 (Option 2).
Deeper Support: 3,311.
3. Fibonacci Analysis
The recent drop from 3,390 to 3,346 shows the 0.5 retracement at ~3,368 and the 0.618 retracement at ~3,375.
Both levels overlap with strong resistance, increasing the likelihood of a bearish reaction from these zones.
4. Trading Strategies for Today
Scenario 1 (Preferred – Short): Wait for a pullback toward 3,360 – 3,375. If a reversal signal forms (e.g., pin bar, engulfing), consider short positions.
TP: 3,351 → 3,325
SL: Above 3,380
Scenario 2 (Countertrend – Long): If the price holds above 3,350 and breaks 3,361 with strong volume, consider a quick long trade toward 3,375.
SL: Below 3,346
Note: The H1 trend remains bearish, so long trades should have tighter risk management.
5. Additional Confirmation Signals
RSI on H1 is around 45–50, showing a neutral zone – watch for a breakout from the current range for confirmation.
Volume is decreasing, suggesting a potential volatility breakout soon.
Keep these levels on your watchlist and wait for a clear breakout or rejection before entering trades to avoid false moves.
Previously, gold moved within an ascending channel but broke down on Aug 9, accompanied by strong selling pressure.
The price is now consolidating sideways around the 3,350 – 3,351 support zone (Option 1), with decreasing volume.
Short-term EMAs (EMA20, EMA50) are still below EMA200, indicating the short-term trend remains bearish.
2. Key Support & Resistance Levels
Immediate Support: 3,350 – 3,351 (a breakdown could send the price toward 3,325).
Near-term Resistance: 3,360 – 3,361 (aligned with EMA50 on H1).
Major Resistance: 3,375 – 3,380 (Option 2).
Deeper Support: 3,311.
3. Fibonacci Analysis
The recent drop from 3,390 to 3,346 shows the 0.5 retracement at ~3,368 and the 0.618 retracement at ~3,375.
Both levels overlap with strong resistance, increasing the likelihood of a bearish reaction from these zones.
4. Trading Strategies for Today
Scenario 1 (Preferred – Short): Wait for a pullback toward 3,360 – 3,375. If a reversal signal forms (e.g., pin bar, engulfing), consider short positions.
TP: 3,351 → 3,325
SL: Above 3,380
Scenario 2 (Countertrend – Long): If the price holds above 3,350 and breaks 3,361 with strong volume, consider a quick long trade toward 3,375.
SL: Below 3,346
Note: The H1 trend remains bearish, so long trades should have tighter risk management.
5. Additional Confirmation Signals
RSI on H1 is around 45–50, showing a neutral zone – watch for a breakout from the current range for confirmation.
Volume is decreasing, suggesting a potential volatility breakout soon.
Keep these levels on your watchlist and wait for a clear breakout or rejection before entering trades to avoid false moves.
🪙 JOIN OUR FREE TELEGRAM GROUP 🪙
t.me/dnaprofits
Join the community group to get support and share knowledge!
️🥇 Exchange and learn market knowledge
️🥇 Support free trading signals
t.me/dnaprofits
Join the community group to get support and share knowledge!
️🥇 Exchange and learn market knowledge
️🥇 Support free trading signals
Related publications
Disclaimer
The information and publications are not meant to be, and do not constitute, financial, investment, trading, or other types of advice or recommendations supplied or endorsed by TradingView. Read more in the Terms of Use.