Trend: Strong bullish rally from Aug 24 up to Sep 3 (higher highs & higher lows
Current Zone: Price at $3,559 after hitting resistance around $3,566.
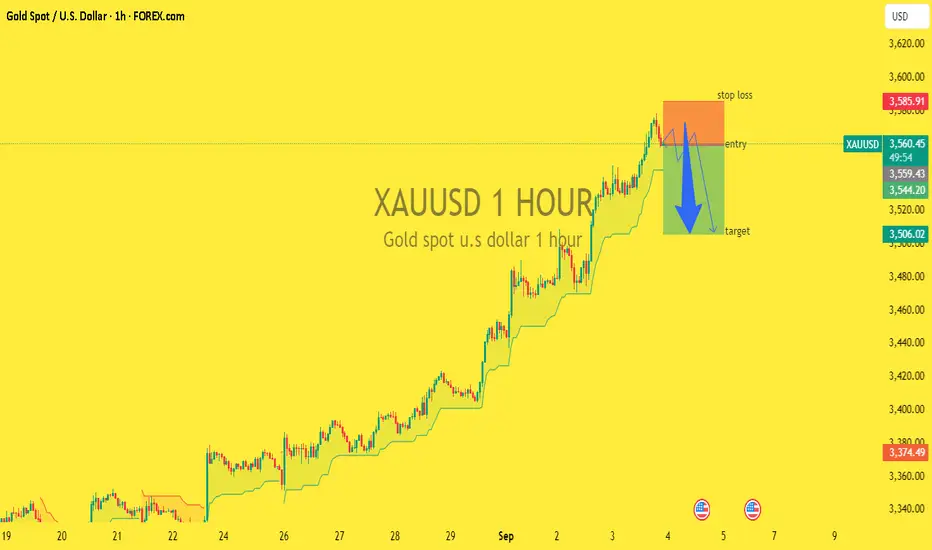
Trade Setup on Chart:
Entry: Around $3,559
Stop Loss (SL): $3,585 (above recent high)
Take Profit (TP): $3,506 (support area)
The setup suggests a short (sell) trade after the strong rally.
The reasoning:
Price is overextended after continuous bullish movement.
There’s resistance near $3,566 – $3,585.
Expecting a pullback correction to the $3,506 – $3,520 zone.
Resistance: $3,566 – $3,585 (sell zone / SL area
Entry: $3,559
Target (TP): $3,506 (support).
Deeper support: $3,480 if momentum continues down
The chart shows a short-term correction trade within a bigger bullish trend.
Good R/R risk/reward if short from $3,559 → TP $3,506.
Trade active
Congratulations guys our sell side chart analysis has been hit wit along 490 pips moves in sell positionTrade closed: target reached
Best Analysis xauusd single
t.me/+uAIef7IqwSs4M2Q0
VIP PREMIMUM ANALYSIS ROOM SIGNALS
t.me/+uAIef7IqwSs4M2Q0
t.me/+uAIef7IqwSs4M2Q0
VIP PREMIMUM ANALYSIS ROOM SIGNALS
t.me/+uAIef7IqwSs4M2Q0
Disclaimer
The information and publications are not meant to be, and do not constitute, financial, investment, trading, or other types of advice or recommendations supplied or endorsed by TradingView. Read more in the Terms of Use.