I'm provided for XAUUSD (Gold Spot / U.S. Dollar) on the 2-hour timeframe, here's the analysis:
---
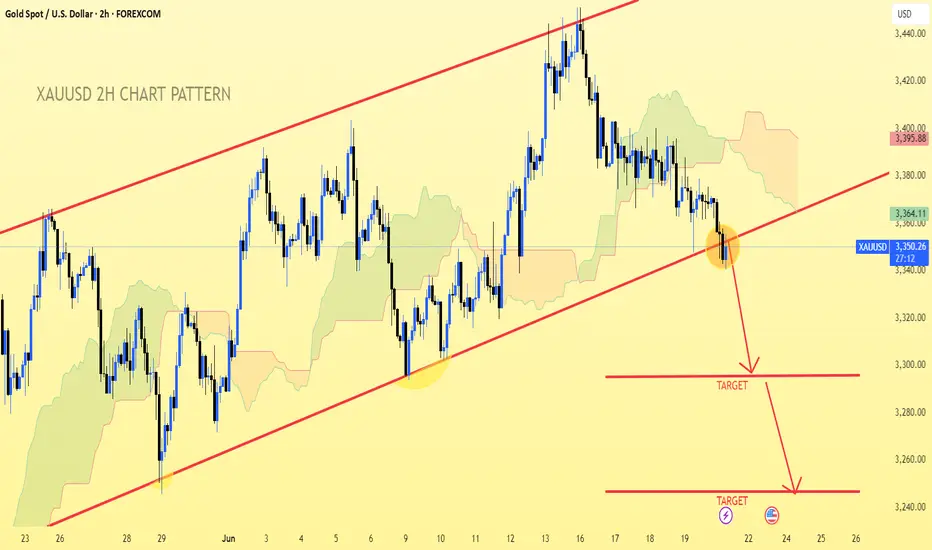
📉 Chart Pattern Insight
A clear ascending channel was forming.
Price broke below the lower trendline (highlighted in orange), signaling a potential bearish breakdown.
The price is currently retesting the broken trendline and starting to reject it — a bearish sign.
---
🎯 Target Levels Identified on Chart
You’ve marked two bearish targets with arrows:
1. First Target: Around $3,280
This aligns with a previous minor support area.
A reasonable short-term target after the trendline break.
2. Second (Deeper) Target: Around $3,245
Likely based on the full height of the channel projected downward (measured move).
This level could be the next major support.
---
📌 Summary:
Target Price Level Confidence
First Target ~$3,280 Medium-High
Final Target ~$3,245 Medium
---
Let me know if you'd like help setting stop-loss levels, trade management tips, or a risk-reward calculation based on your entry.
---
📉 Chart Pattern Insight
A clear ascending channel was forming.
Price broke below the lower trendline (highlighted in orange), signaling a potential bearish breakdown.
The price is currently retesting the broken trendline and starting to reject it — a bearish sign.
---
🎯 Target Levels Identified on Chart
You’ve marked two bearish targets with arrows:
1. First Target: Around $3,280
This aligns with a previous minor support area.
A reasonable short-term target after the trendline break.
2. Second (Deeper) Target: Around $3,245
Likely based on the full height of the channel projected downward (measured move).
This level could be the next major support.
---
📌 Summary:
Target Price Level Confidence
First Target ~$3,280 Medium-High
Final Target ~$3,245 Medium
---
Let me know if you'd like help setting stop-loss levels, trade management tips, or a risk-reward calculation based on your entry.
Trade active
trade activeNote
1st target almost done📲 Join telegram channel free ..
t.me/EU_USA_AND_CHAINA_TRADER
Forex, Gold & Crypto Signals with detailed analysis & get consistent results..
Gold Signal's with proper TP & SL for high profit ..
t.me/+GnRTz3YWKk9mZDM8
t.me/EU_USA_AND_CHAINA_TRADER
Forex, Gold & Crypto Signals with detailed analysis & get consistent results..
Gold Signal's with proper TP & SL for high profit ..
t.me/+GnRTz3YWKk9mZDM8
Related publications
Disclaimer
The information and publications are not meant to be, and do not constitute, financial, investment, trading, or other types of advice or recommendations supplied or endorsed by TradingView. Read more in the Terms of Use.
📲 Join telegram channel free ..
t.me/EU_USA_AND_CHAINA_TRADER
Forex, Gold & Crypto Signals with detailed analysis & get consistent results..
Gold Signal's with proper TP & SL for high profit ..
t.me/+GnRTz3YWKk9mZDM8
t.me/EU_USA_AND_CHAINA_TRADER
Forex, Gold & Crypto Signals with detailed analysis & get consistent results..
Gold Signal's with proper TP & SL for high profit ..
t.me/+GnRTz3YWKk9mZDM8
Related publications
Disclaimer
The information and publications are not meant to be, and do not constitute, financial, investment, trading, or other types of advice or recommendations supplied or endorsed by TradingView. Read more in the Terms of Use.