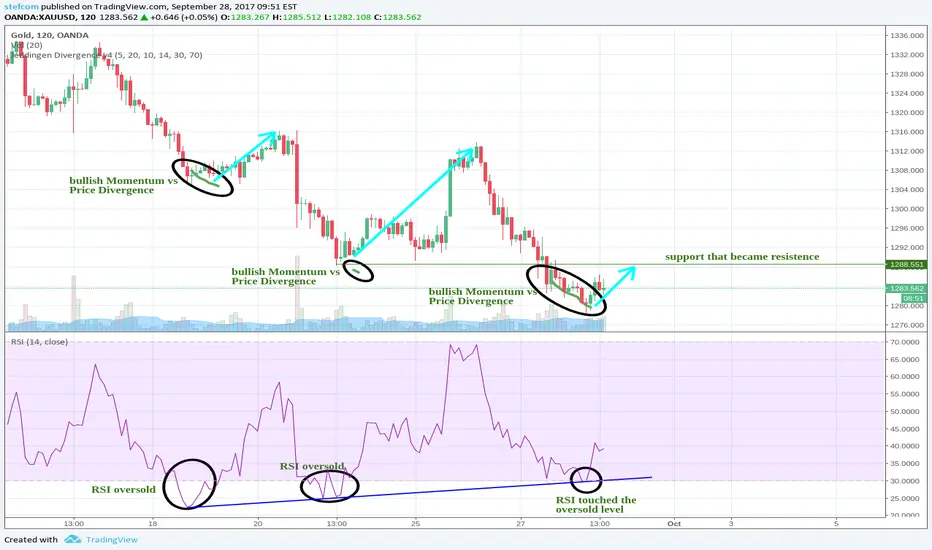
On the 2H chart, there is a Divergence of Price against Momentum. My Indicator/ Study "Jeddingen Divergence" shows green lines in case such a Divergence occurs.
The past two Divergences of this kind worked very well - they are shown on the chart as well.
I guess that Price will rise to 1288.551 - there is a former support that now might act as resistance.
The past two Divergences of this kind worked very well - they are shown on the chart as well.
I guess that Price will rise to 1288.551 - there is a former support that now might act as resistance.
Trade closed: target reached
Target was reached, looks like CCIDivergence works very good on the higher timeframes⚡ ProDivergence buy.stripe.com/3cs14e15h6FiaBy6oo
⚡ ProTrend buy.stripe.com/4gweV49BN5Be4da8wx
⚡ GET THE CCIDivergence STUDY FOR FREE: bit.ly/CCIDivFree
⚡ ProTrend buy.stripe.com/4gweV49BN5Be4da8wx
⚡ GET THE CCIDivergence STUDY FOR FREE: bit.ly/CCIDivFree
Related publications
Disclaimer
The information and publications are not meant to be, and do not constitute, financial, investment, trading, or other types of advice or recommendations supplied or endorsed by TradingView. Read more in the Terms of Use.
⚡ ProDivergence buy.stripe.com/3cs14e15h6FiaBy6oo
⚡ ProTrend buy.stripe.com/4gweV49BN5Be4da8wx
⚡ GET THE CCIDivergence STUDY FOR FREE: bit.ly/CCIDivFree
⚡ ProTrend buy.stripe.com/4gweV49BN5Be4da8wx
⚡ GET THE CCIDivergence STUDY FOR FREE: bit.ly/CCIDivFree
Related publications
Disclaimer
The information and publications are not meant to be, and do not constitute, financial, investment, trading, or other types of advice or recommendations supplied or endorsed by TradingView. Read more in the Terms of Use.