🌀 Elliott Wave Structure Timeframe: H4
Currently, price action is overlapping with multiple abc correction patterns. To reduce noise and gain a clearer perspective, I’ve shifted the analysis to the H4 timeframe.
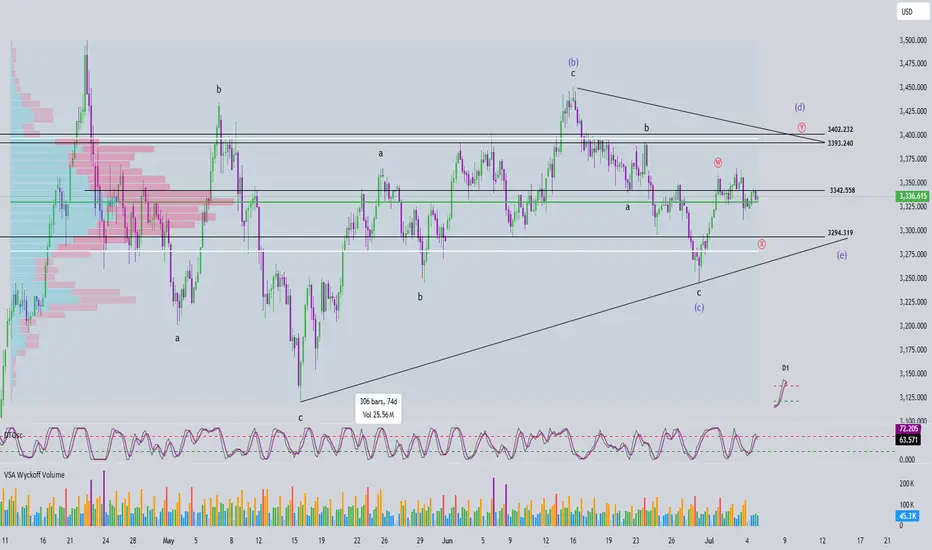
From the 3500 level down to now, the entire corrective move has been composed of overlapping abc patterns rather than sharp, impulsive rallies. This suggests we are likely forming a contracting triangle correction in the form of abcde (green) as shown on the chart.
At the moment, price appears to be in wave d (green), which is unfolding as a wxy structure (red).
Trading during triangle corrections is particularly challenging due to the complex interweaving of corrective waves. Additionally, price is consolidating within the Volume Profile’s high-liquidity zone, as shown on the chart. Therefore, it is best to remain patient and wait for the triangle pattern to complete.
📉 Momentum
Daily (D1) momentum: Currently showing signs of a bearish reversal → suggesting that price may move sideways or lower this week. (Toward the end of a triangle, price tends to compress and lose clear directional bias.)
H4 momentum: Also shows reversal signals, and a strong bearish candle has recently formed. Thus, a short-term bearish bias is preferred until H4 momentum reaches the oversold region.
🎯 Price Targets
Since the market is currently forming overlapping abc structures, setting precise wave targets is difficult. Therefore, I rely on Volume Profile zones to define key levels:
3342 Resistance Zone: Marks the boundary between high and low liquidity areas → This is a Sell Zone, supported by confluence with D1 and H4 momentum signals.
3294 Support Zone: Represents the lower boundary of high liquidity → This is the projected end of wave X (red) and serves as our Buy Zone.
🧭 Trade Plan
🔻 Sell Zone:
Entry: 3340 – 3342
SL: 3350
TP1: 3320
TP2: 3300
🔺 Buy Zone:
Entry: 3295 – 3293
SL: 3285
TP1: 3312
TP2: 3342
TP3: 3390
📌 Personal Note:
At this stage, I prefer to wait for the abcde triangle to complete or for more structural confirmation. If you decide to trade, focus on short-term setups with reduced position size to manage risk during this complex correction phase.
Currently, price action is overlapping with multiple abc correction patterns. To reduce noise and gain a clearer perspective, I’ve shifted the analysis to the H4 timeframe.
From the 3500 level down to now, the entire corrective move has been composed of overlapping abc patterns rather than sharp, impulsive rallies. This suggests we are likely forming a contracting triangle correction in the form of abcde (green) as shown on the chart.
At the moment, price appears to be in wave d (green), which is unfolding as a wxy structure (red).
Trading during triangle corrections is particularly challenging due to the complex interweaving of corrective waves. Additionally, price is consolidating within the Volume Profile’s high-liquidity zone, as shown on the chart. Therefore, it is best to remain patient and wait for the triangle pattern to complete.
📉 Momentum
Daily (D1) momentum: Currently showing signs of a bearish reversal → suggesting that price may move sideways or lower this week. (Toward the end of a triangle, price tends to compress and lose clear directional bias.)
H4 momentum: Also shows reversal signals, and a strong bearish candle has recently formed. Thus, a short-term bearish bias is preferred until H4 momentum reaches the oversold region.
🎯 Price Targets
Since the market is currently forming overlapping abc structures, setting precise wave targets is difficult. Therefore, I rely on Volume Profile zones to define key levels:
3342 Resistance Zone: Marks the boundary between high and low liquidity areas → This is a Sell Zone, supported by confluence with D1 and H4 momentum signals.
3294 Support Zone: Represents the lower boundary of high liquidity → This is the projected end of wave X (red) and serves as our Buy Zone.
🧭 Trade Plan
🔻 Sell Zone:
Entry: 3340 – 3342
SL: 3350
TP1: 3320
TP2: 3300
🔺 Buy Zone:
Entry: 3295 – 3293
SL: 3285
TP1: 3312
TP2: 3342
TP3: 3390
📌 Personal Note:
At this stage, I prefer to wait for the abcde triangle to complete or for more structural confirmation. If you decide to trade, focus on short-term setups with reduced position size to manage risk during this complex correction phase.
Trade active
SELL Zone Plan: 3340 – 3342: +300 pips😘😘Trade closed: target reached
SELL Zone Plan: 3340 – 3342: +400 pipsNote
📌 Although it’s difficult to place an exact limit order at this stage, price action is still unfolding in line with our projected scenario.This confirms that our wave structure and analysis are playing out well — we just need to stay patient and monitor price behavior closely to find the right entry.
👉 Join the channel to receive more scalping signals!
Channel Telegram: t.me/+XkFQ95yHVOEwNDc1
Channel Telegram: t.me/+XkFQ95yHVOEwNDc1
Related publications
Disclaimer
The information and publications are not meant to be, and do not constitute, financial, investment, trading, or other types of advice or recommendations supplied or endorsed by TradingView. Read more in the Terms of Use.