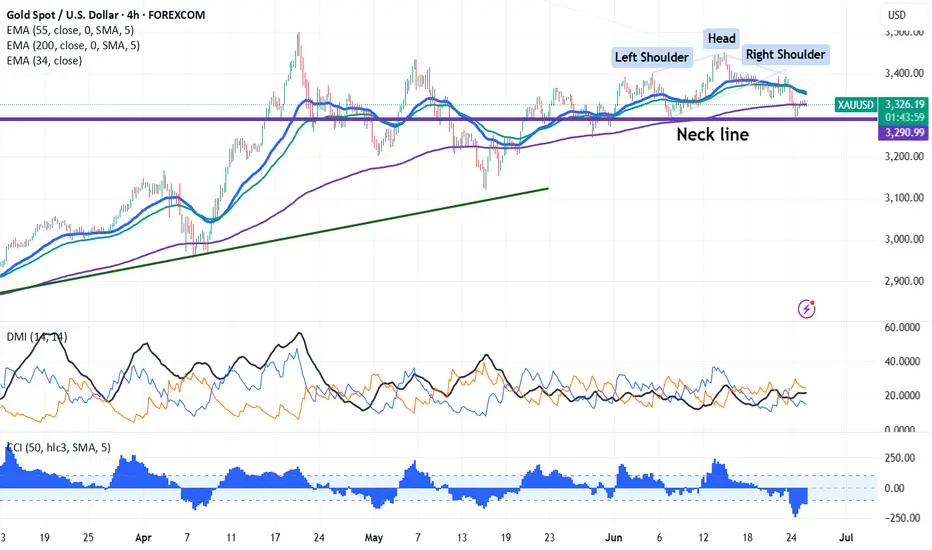
Chart pattern-Head and Shoulder
Gold pared most of its gains as Israel and Iran ceasefire agreement. It hits an low of $3295 and is currently trading around $3327.
Gold prices are holding below short term moving average 34 EMA and 55 EMA and above long-term moving averages (200 EMA) on the 4-hour chart. Immediate support is at $3340 and a break below this level will drag the yellow metal to $3330/$3300. The near-term resistance is at $3385 with potential price targets at $3400/43420$3450/$3475/$3500/$3550.
It is good to sell below $3295 with a stop-loss at $3330 for a target price of $3000.
Disclaimer
The information and publications are not meant to be, and do not constitute, financial, investment, trading, or other types of advice or recommendations supplied or endorsed by TradingView. Read more in the Terms of Use.
Disclaimer
The information and publications are not meant to be, and do not constitute, financial, investment, trading, or other types of advice or recommendations supplied or endorsed by TradingView. Read more in the Terms of Use.