From a technical perspective, last week's failure near the top boundary of an ascending channel extending from late July and the subsequent pullback from the all-time peak could be seen as a sign of bullish exhaustion. However, mixed oscillators on the daily chart warrant some caution before positioning for further losses. Hence, any further decline is more likely to find some support near the $2,720-2,715 horizontal zone, below which the Gold price could aim to challenge the trend-channel support, currently pegged near the $2,690 region. Some follow-through selling would mark a bearish breakdown and pave the way for some meaningful corrective fall in the near term.
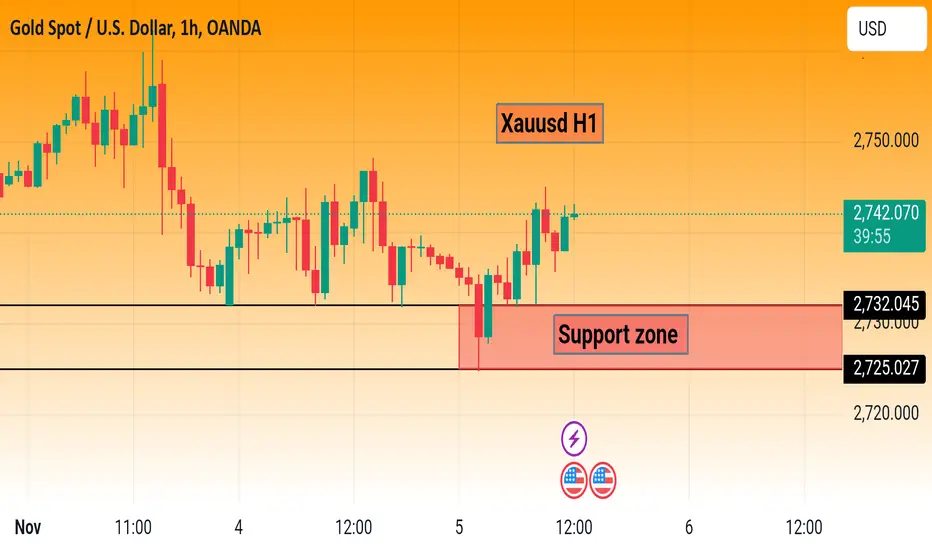
Gold now sell 2740
Support 2730
Support 2725
Gold now sell 2740
Support 2730
Support 2725
Note
Hello everyone Note
Follow my chart Note
Gold sell 10 pips running Note
Gold sell 20 pips running Note
Confirm signal Note
Xauusd sell Note
Next Target 2725 Note
Gold sell 50 pips running Note
Gold sell 60 pips done Note
Follow my chart Note
Confirm signal Note
1 support hit 120 pips done Note
Confirm signal Note
Follow my chart Gold signal
t.me/ProTrader_9
My Channel Link
t.me/ProTrader_9
Check My Performance
t.me/ProTrader_9
My Channel Link
t.me/ProTrader_9
Check My Performance
Disclaimer
The information and publications are not meant to be, and do not constitute, financial, investment, trading, or other types of advice or recommendations supplied or endorsed by TradingView. Read more in the Terms of Use.
Gold signal
t.me/ProTrader_9
My Channel Link
t.me/ProTrader_9
Check My Performance
t.me/ProTrader_9
My Channel Link
t.me/ProTrader_9
Check My Performance
Disclaimer
The information and publications are not meant to be, and do not constitute, financial, investment, trading, or other types of advice or recommendations supplied or endorsed by TradingView. Read more in the Terms of Use.