DXY has fallen to its lowest level since August in Asia on Tuesday. Gold experienced a downward correction on Monday, falling to $1,965 at one point, but then rebounded. DXY also fell to more than two-month lows on Monday, extending last week's losses.
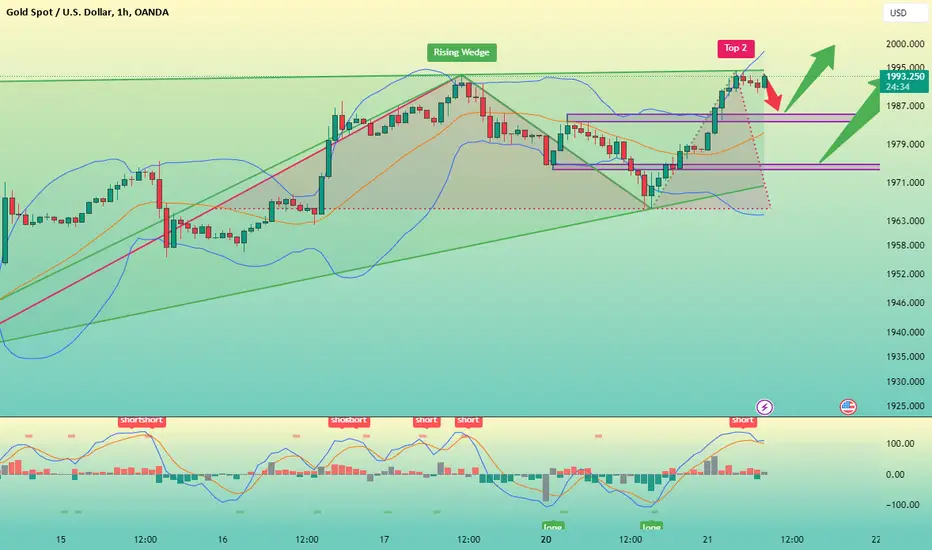
Judging from the one-hour chart, the price of gold has experienced a bottoming process and quickly recovered its lost ground. This is a common correction technique in the bull market, which drives the short-term moving average indicators to turn upward. The overall trend shows a big "V" shape. It started to fall from the 1985 position in the morning, and the US market fell to the 1965 line. Then it started to rebound and rise from the low of 1965, and today the Asian market rushed all the way to the 1990 line. From the four-hour level, gold is in a continuous upward trend, with the Bollinger Bands opening upward. After the first line encountered resistance in 1995, the gold price retreated and a platform resistance appeared at 1985. If gold prices hold at this level again today, gold could turn higher; otherwise, a retracement could occur.
Gold rebounded quickly after hitting a deep bottom, further demonstrating that gold has strong support. Today's operation advice is to consider scalping and shorting on rebounds, and mainly going long at low prices.
SELL:1995-1997
SL:2001
TP1:1901
TP2:1986
BUY:1984-1986
SL: 1980
TP1:1992
TP2:1998
Trade active
Trade active
💥Telegram Channel Free Updates 👉🏻
💥t.me/Actuary00group
✉️Signal and daily analysis channel
💥t.me/Actuary00group
✉️Signal and daily analysis channel
Related publications
Disclaimer
The information and publications are not meant to be, and do not constitute, financial, investment, trading, or other types of advice or recommendations supplied or endorsed by TradingView. Read more in the Terms of Use.