Core logic analysis
Driving factors
Safe-haven demand: The widening US fiscal deficit (US$36 trillion in debt), sovereign rating downgrades, and political uncertainty (debt concerns caused by Trump's policies) continue to support gold.
Weakened US dollar: The weak US dollar index has increased the attractiveness of gold to non-US investors, and physical buying is active.
Technical breakthrough: Gold prices have stabilized at key support levels, forming a long structure.
Risk warning
If US economic data exceeds expectations (such as inflation rebound, strong employment) or the Federal Reserve releases hawkish signals, gold prices may be suppressed.
Geopolitical easing or short-term relief of debt problems may weaken risk aversion.
Technical analysis refinement
Key price levels
Support range: 3315-3320 (trend line + hourly moving average adhesion area), 3305 (Bollinger middle track & long-short watershed).
Resistance range: 3375-3380 (previous high concentration area), 3428 (open upside space after breakthrough).
Indicator signal: If the Bollinger Bands open upward after closing, the bullish momentum can be confirmed with the MACD golden cross.
Pattern observation:
If the 4-hour chart forms a "high point rise, low point rise" structure, the upward trend will be strengthened; if it falls below 3305, be alert to the callback to 3280.
Operation strategy optimization
1. Long strategy (main idea)
Entry area: 3315-3320 (light position), 3305 (covering position).
Stop loss setting: below 3300 (avoid false breakthrough and loss).
Target position:
The first target is 3350 (short-term profit-taking of some positions).
The second target is 3380 (hold and look to 3428 after breaking through).
Adding position conditions: breaking through 3380 with large volume and confirming by stepping back.
2. Short hedging strategy (backup)
Trigger condition: breaking through 3305 and confirmed by 1-hour closing.
Entry point: 3300-3305.
Stop loss: above 3320.
Target: 3280 (previous low support), 3250 (lower track of medium-term channel).
Events to watch next week
Policy trends:
Speech by Fed officials (especially the tone before the June interest rate meeting).
Debt progress:
The result of the Senate vote on the US fiscal bill and the market reaction.
Summary
Trend dominance: fundamentals and technical resonance are more bullish, but be wary of profit-taking at high levels.
Position management: It is recommended that the total position is ≤5%, and the stop loss strictly follows the 1%-2% account risk principle.
Flexible response: If 3380 cannot be broken for a long time, some positions can be closed and wait and see; if it breaks through, increase the position accordingly.
Trade active
Technical analysis of gold:
In terms of 4 hours, after the continuous rise on Friday, it once again effectively crossed the short-term moving average and drove the short-term moving average upward. Other periodic indicators are arranged in a bullish pattern, and the Bollinger Bands are generally upward. In addition, the MACD indicator is in a golden cross pattern and intends to continue to rise, with sufficient upward potential, so the overall bullish trend at the 4-hour level can be expected to continue. For the support at the beginning of this week, pay attention to the 3315 area. Above it, first look at the stabilization of 3340. If it can break through, look at the 3370 line. Otherwise, it may fall into a volatile trend. Since Monday is the Memorial Day in the United States and there is no US market, as for the resistance, pay attention to the vicinity of 3370 first, and then focus on the strong pressure around 3386.
On the whole, the short-term operation strategy for gold today is to sell on rebounds as the main strategy, and to buy on pullbacks as the auxiliary strategy. The short-term focus on the upper side is the 3365-3370 line of resistance, and the short-term focus on the lower side is the 3320-3315 line of support.
Trade closed: target reached
Analysis strategy for the latest gold trend on May 27:
Market background review
Risk aversion cools down: Due to the impact of Trump-related news, the safe-haven demand for gold has weakened, resulting in a high and fall on Monday (May 26), and continued weakness in the Asian and European sessions.
Impact of the US market closure: Due to the Memorial Day holiday in the United States, market liquidity is low, market volatility is limited, and the overall trend is volatile and downward.
Key technical analysis
1. 4-hour level trend
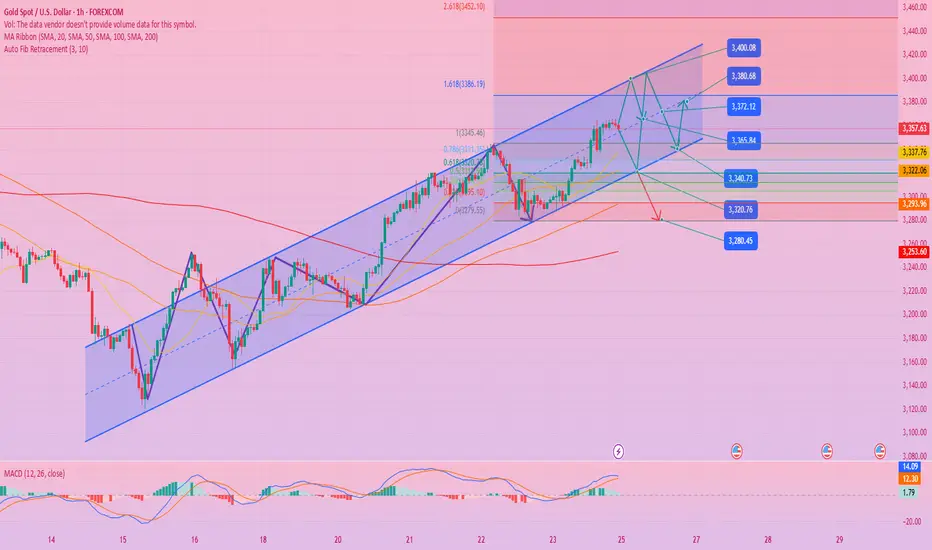
Bollinger band structure: Gold prices fell after touching the upper track of the Bollinger band (near 3365), and are currently seeking support near the middle track (3320-3323), which is also the starting point of last Friday's rise.
Moving average system:
MA5 crosses MA10, showing a short-term adjustment signal.
Long-term moving averages (such as MA60) are still higher than medium-term moving averages, indicating that the general trend has not completely turned to bearish, but there is still a need for a short-term correction.
RSI indicator: Falling back from the overbought area to near the middle line (3357 corresponding price), suggesting that there is still room for decline.
2. Key price structure
Resistance:
3342 (Monday's rebound high)
3350 (psychological barrier)
3365 (double top pressure, strong resistance)
Support:
3320-3323 (4-hour Bollinger middle rail + last Friday's starting point)
3300-3305 (key integer barrier, if it falls below, it may accelerate downward)
3. Short-term trend judgment
Two attacks on 3365 failed, and Monday opened lower, indicating that the bulls lack momentum and the short-term trend is oscillating downward.
The 1-hour chart forms a descending channel. If it falls below 3320, it may further test the 3300 support.
If it rebounds to the 3342-3350 area under pressure, it is still a short-selling opportunity.
Today's trading strategy
1. Short-order opportunity (main strategy)
Entry point: 3342-3350 range, arrange short orders in batches
Stop loss: above 3355 (to prevent false breakthroughs)
Target: 3320 (first target), look at 3305-3300 after breaking
2. Long-order opportunity (auxiliary strategy)
Entry conditions: first touch 3300-3305 without breaking, you can try long with a light position
Stop loss: below 3295 (to prevent the break from accelerating the decline)
Target: 3320-3325 (short-term rebound)
3. Key risk warning
If the gold price stands above 3350, it may test 3365 again, and short orders should be cautious.
If it falls below 3300, it may further test the support of 3280-3270, and attention should be paid to changes in market sentiment.
Summary and Operational Suggestions
✅ Main idea: short sell when the price rebounds to 3342-3350, target 3320-3300.
✅ Secondary idea: short-term long sell when the price stabilizes near 3300, quick in and quick out.
⚠️ Note: Pay attention to the changes in market liquidity after the resumption of trading in the US market today, and avoid heavy positions before major data.
(The above analysis is based on the current technical structure, and specific transactions need to be flexibly adjusted in combination with the real-time market.)
Related publications
Disclaimer
The information and publications are not meant to be, and do not constitute, financial, investment, trading, or other types of advice or recommendations supplied or endorsed by TradingView. Read more in the Terms of Use.
Related publications
Disclaimer
The information and publications are not meant to be, and do not constitute, financial, investment, trading, or other types of advice or recommendations supplied or endorsed by TradingView. Read more in the Terms of Use.