🧠 GOLD (XAU/USD) Technical Analysis
GOLD has been trading in a broad bullish trend, supported by global uncertainty and consistent interest in safe-haven assets. However, today’s intraday structure shows signs of potential exhaustion after a clean tap of a major resistance/QFL zone.
In this analysis, I break down the key zones, trader psychology, market structure, and potential playbook for upcoming moves.
📊 Technical Structure Breakdown:
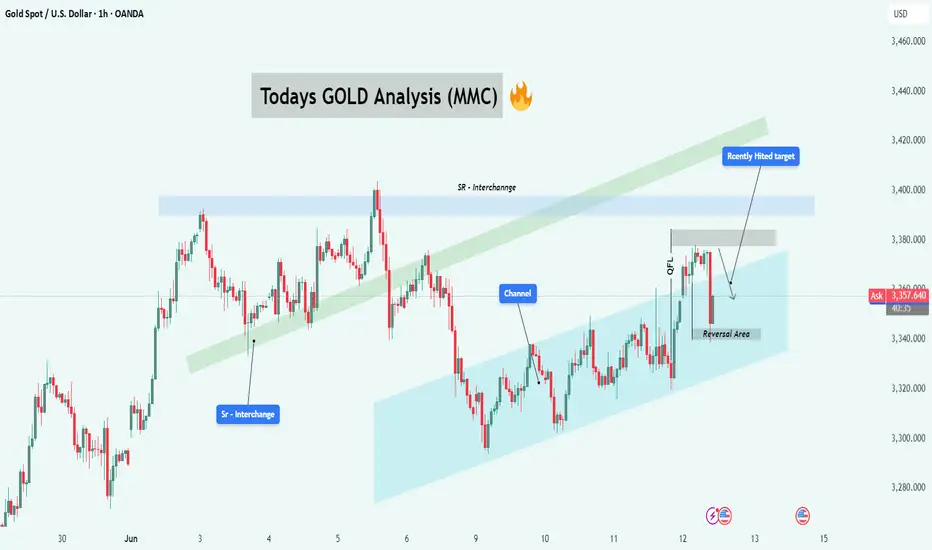
🔷 1. SR Interchange Zone – The Flip Level
Marked early in the chart, the SR Interchange area served as a major resistance, which was broken and then retested — confirming a classic S/R flip. This level added confluence to the uptrend that followed.
Trader Insight: This is where buyers got confident after the retest. Smart money often leaves footprints at such interchange zones.
🔷 2. Ascending Channel – The Guiding Rail
GOLD has been respecting an upward channel for several days. Price bounced multiple times off both upper and lower channel boundaries. This gives a clear roadmap for intraday traders to watch for bounces, midline reactions, and possible breakouts.
Channel dynamics: Right now, price has rejected from the top of the channel, suggesting possible movement back toward the midline or bottom rail.
🔷 3. QFL Rejection – Trap Zone Activated
Price recently hit the QFL zone, which aligns closely with previous highs and liquidity pools. This level acted as a liquidity trap where buyers got over-leveraged or late entries piled in — only to see a strong rejection right after.
This sharp drop from the QFL area signals institutional sell pressure or heavy profit-taking. It’s not just a pullback — it’s a signal.
🧱 Key Zones to Watch:
Zone Type Relevance
$3,380 - $3,400 QFL / Resistance Rejection point, likely full of stop-losses and liquidity
$3,340 - $3,320 Reversal Area / Demand Potential buyer re-entry and bounce zone
$3,300 and below Liquidity Pool If demand fails, price could slide into this liquidity zone
📉 Bearish Case: Reversal in Motion?
If the current rejection from QFL continues without any strong bounce at the reversal zone:
Expect price to retest the lower channel and possibly breakdown.
Sell pressure could increase due to trapped long positions trying to exit.
Target: $3,320 → $3,300 → possible $3,280 extension.
✅ Entry: Look for failed retests of the QFL zone or lower highs
📍 SL: Above $3,385
🎯 TP: First target near $3,320, then trail stops.
📈 Bullish Case: Controlled Pullback Before Lift-Off
If price finds strong support in the Reversal Area:
Look for bullish engulfing, hammer, or double bottom patterns in the area.
Could be a healthy pullback before continuation to $3,400+.
Target: $3,380 → $3,420 and even higher if breakout is strong.
✅ Entry: Confirmation after bullish reaction at $3,340 zone
📍 SL: Below $3,315
🎯 TP: $3,380+, trail if breakout holds
🔄 Trader Psychology in Action:
Late buyers entered after the breakout toward $3,380.
Smart money exited near the top or flipped bias near QFL.
Retail panic selling might happen if support fails, offering re-entry for institutions at better prices.
Discipline Tip: Let price confirm your bias. Don’t chase.
📌 Final Thoughts & Trade Plan:
GOLD is at a decision point. Whether you're trading intraday or swing, your focus should be on:
Watching how price reacts to the Reversal Area
Identifying fakeouts vs true breaks at channel boundaries
Staying patient for confirmation (don’t jump in on impulse)
This setup provides an excellent opportunity for both bullish and bearish traders — just stay unbiased and reactive, not predictive.
GOLD has been trading in a broad bullish trend, supported by global uncertainty and consistent interest in safe-haven assets. However, today’s intraday structure shows signs of potential exhaustion after a clean tap of a major resistance/QFL zone.
In this analysis, I break down the key zones, trader psychology, market structure, and potential playbook for upcoming moves.
📊 Technical Structure Breakdown:
🔷 1. SR Interchange Zone – The Flip Level
Marked early in the chart, the SR Interchange area served as a major resistance, which was broken and then retested — confirming a classic S/R flip. This level added confluence to the uptrend that followed.
Trader Insight: This is where buyers got confident after the retest. Smart money often leaves footprints at such interchange zones.
🔷 2. Ascending Channel – The Guiding Rail
GOLD has been respecting an upward channel for several days. Price bounced multiple times off both upper and lower channel boundaries. This gives a clear roadmap for intraday traders to watch for bounces, midline reactions, and possible breakouts.
Channel dynamics: Right now, price has rejected from the top of the channel, suggesting possible movement back toward the midline or bottom rail.
🔷 3. QFL Rejection – Trap Zone Activated
Price recently hit the QFL zone, which aligns closely with previous highs and liquidity pools. This level acted as a liquidity trap where buyers got over-leveraged or late entries piled in — only to see a strong rejection right after.
This sharp drop from the QFL area signals institutional sell pressure or heavy profit-taking. It’s not just a pullback — it’s a signal.
🧱 Key Zones to Watch:
Zone Type Relevance
$3,380 - $3,400 QFL / Resistance Rejection point, likely full of stop-losses and liquidity
$3,340 - $3,320 Reversal Area / Demand Potential buyer re-entry and bounce zone
$3,300 and below Liquidity Pool If demand fails, price could slide into this liquidity zone
📉 Bearish Case: Reversal in Motion?
If the current rejection from QFL continues without any strong bounce at the reversal zone:
Expect price to retest the lower channel and possibly breakdown.
Sell pressure could increase due to trapped long positions trying to exit.
Target: $3,320 → $3,300 → possible $3,280 extension.
✅ Entry: Look for failed retests of the QFL zone or lower highs
📍 SL: Above $3,385
🎯 TP: First target near $3,320, then trail stops.
📈 Bullish Case: Controlled Pullback Before Lift-Off
If price finds strong support in the Reversal Area:
Look for bullish engulfing, hammer, or double bottom patterns in the area.
Could be a healthy pullback before continuation to $3,400+.
Target: $3,380 → $3,420 and even higher if breakout is strong.
✅ Entry: Confirmation after bullish reaction at $3,340 zone
📍 SL: Below $3,315
🎯 TP: $3,380+, trail if breakout holds
🔄 Trader Psychology in Action:
Late buyers entered after the breakout toward $3,380.
Smart money exited near the top or flipped bias near QFL.
Retail panic selling might happen if support fails, offering re-entry for institutions at better prices.
Discipline Tip: Let price confirm your bias. Don’t chase.
📌 Final Thoughts & Trade Plan:
GOLD is at a decision point. Whether you're trading intraday or swing, your focus should be on:
Watching how price reacts to the Reversal Area
Identifying fakeouts vs true breaks at channel boundaries
Staying patient for confirmation (don’t jump in on impulse)
This setup provides an excellent opportunity for both bullish and bearish traders — just stay unbiased and reactive, not predictive.
Related publications
Disclaimer
The information and publications are not meant to be, and do not constitute, financial, investment, trading, or other types of advice or recommendations supplied or endorsed by TradingView. Read more in the Terms of Use.
Related publications
Disclaimer
The information and publications are not meant to be, and do not constitute, financial, investment, trading, or other types of advice or recommendations supplied or endorsed by TradingView. Read more in the Terms of Use.