Technical Analysis
1. Key Support & Resistance Levels
Short-term Resistance: 3,375–3,380 USD (previous consolidation zone now acting as supply)
Major Support: 3,300 USD (prior breakout base, possible Fibonacci target zone)
Intermediate Support: 3,335 USD (intraday low during the current correction)
2. Structure & Trend
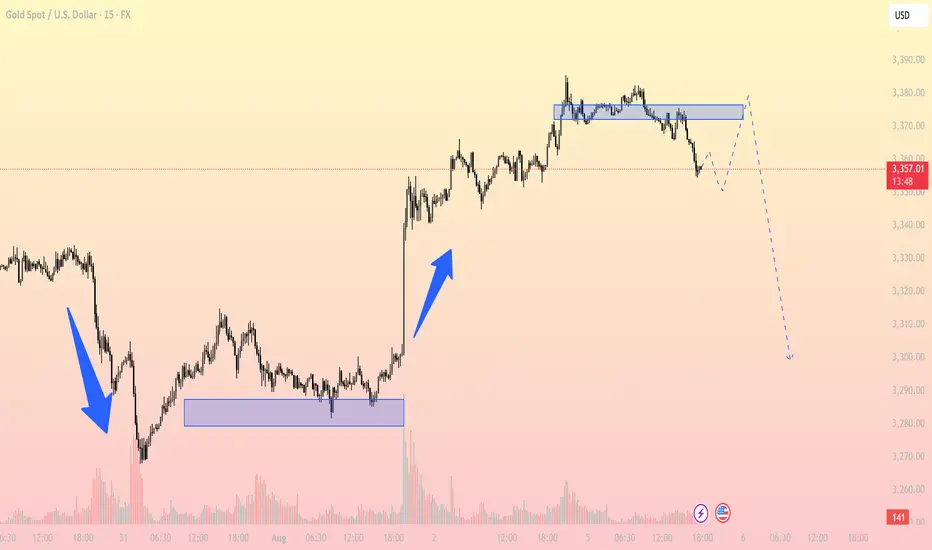
The chart shows a strong bullish impulse on August 2, breaking out of a prolonged consolidation base.
After the breakout, price entered a distribution phase around 3,375 where momentum stalled and volume declined.
A clear breakdown from the distribution zone is now underway, suggesting increased selling pressure and a possible retest of lower demand areas.
3. Price Action Behavior
Price is currently attempting a pullback retest toward the broken structure near 3,370–3,375.
There’s potential for a small head and shoulders pattern, with the neckline near 3,335. A confirmed break below this level could accelerate the move down to 3,300.
4. EMA & RSI Outlook
EMA20 is beginning to turn downward and may soon cross below the EMA50, hinting at a short-term bearish trend shift.
RSI (not shown but worth watching) is likely cooling off from overbought levels, providing space for further downside.
Trading Strategy Ideas:
Sell on pullback to resistance:
Entry zone: 3,370–3,375
Target: 3,335 and 3,300
SL: 3,382
Short-term Buy if RSI oversold + bullish price action: 3,335
Target: 3,370
SL: 3,325
Gold is showing signs of weakness after a sharp rally. The breakdown from the distribution zone indicates a shift in sentiment. If price fails to reclaim 3,375 and confirms below 3,335, the 3,300 support could be the next key destination.
Follow to receive more high-quality trading strategies in upcoming sessions. Save this idea if you found it useful!
1. Key Support & Resistance Levels
Short-term Resistance: 3,375–3,380 USD (previous consolidation zone now acting as supply)
Major Support: 3,300 USD (prior breakout base, possible Fibonacci target zone)
Intermediate Support: 3,335 USD (intraday low during the current correction)
2. Structure & Trend
The chart shows a strong bullish impulse on August 2, breaking out of a prolonged consolidation base.
After the breakout, price entered a distribution phase around 3,375 where momentum stalled and volume declined.
A clear breakdown from the distribution zone is now underway, suggesting increased selling pressure and a possible retest of lower demand areas.
3. Price Action Behavior
Price is currently attempting a pullback retest toward the broken structure near 3,370–3,375.
There’s potential for a small head and shoulders pattern, with the neckline near 3,335. A confirmed break below this level could accelerate the move down to 3,300.
4. EMA & RSI Outlook
EMA20 is beginning to turn downward and may soon cross below the EMA50, hinting at a short-term bearish trend shift.
RSI (not shown but worth watching) is likely cooling off from overbought levels, providing space for further downside.
Trading Strategy Ideas:
Sell on pullback to resistance:
Entry zone: 3,370–3,375
Target: 3,335 and 3,300
SL: 3,382
Short-term Buy if RSI oversold + bullish price action: 3,335
Target: 3,370
SL: 3,325
Gold is showing signs of weakness after a sharp rally. The breakdown from the distribution zone indicates a shift in sentiment. If price fails to reclaim 3,375 and confirms below 3,335, the 3,300 support could be the next key destination.
Follow to receive more high-quality trading strategies in upcoming sessions. Save this idea if you found it useful!
🪙 JOIN OUR FREE TELEGRAM GROUP 🪙
t.me/dnaprofits
Join the community group to get support and share knowledge!
️🥇 Exchange and learn market knowledge
️🥇 Support free trading signals
t.me/dnaprofits
Join the community group to get support and share knowledge!
️🥇 Exchange and learn market knowledge
️🥇 Support free trading signals
Related publications
Disclaimer
The information and publications are not meant to be, and do not constitute, financial, investment, trading, or other types of advice or recommendations supplied or endorsed by TradingView. Read more in the Terms of Use.