It may be difficult to have a bearish bias on gold, but the chart is saying sell!
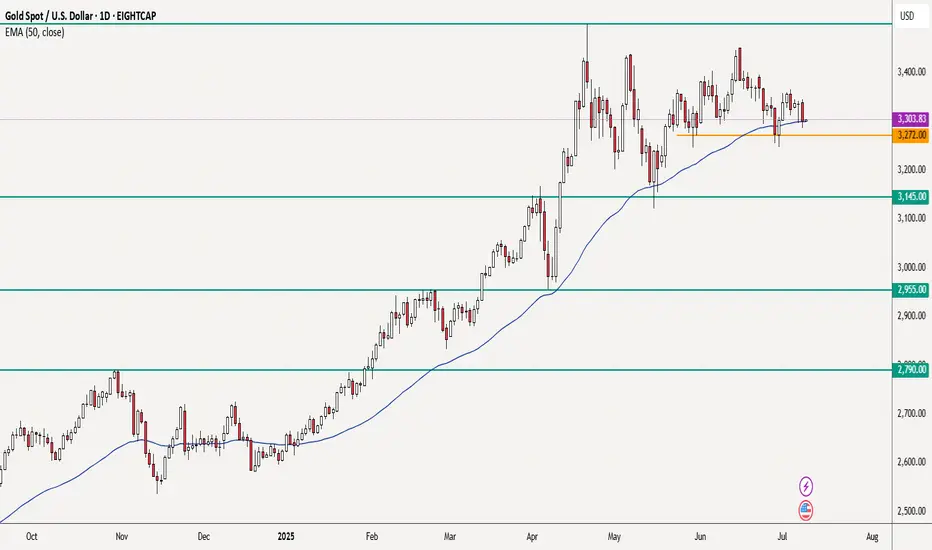
After a prolonged bull run, you can see how price got rejected at $3,500. Subsequent bullish moves became weaker and weaker, you may even see a H&S pattern but more importantly the latest weaker bounce seems to indicate that the local support at 3272 may soon break.
If this plays out as I think, a nice trade will setup. I also took a quick look at the H1 chart and noted that we already have lower daily central pivots. Looking forward to see how PA in the next couple of days develops.
This is not a trade recommendation; it’s merely my own analysis. Trading carries a high level of risk so carefully managing your capital and risk is important. If you like my idea, please give a “boost” and follow me to get even more.
Disclaimer
The information and publications are not meant to be, and do not constitute, financial, investment, trading, or other types of advice or recommendations supplied or endorsed by TradingView. Read more in the Terms of Use.
Disclaimer
The information and publications are not meant to be, and do not constitute, financial, investment, trading, or other types of advice or recommendations supplied or endorsed by TradingView. Read more in the Terms of Use.