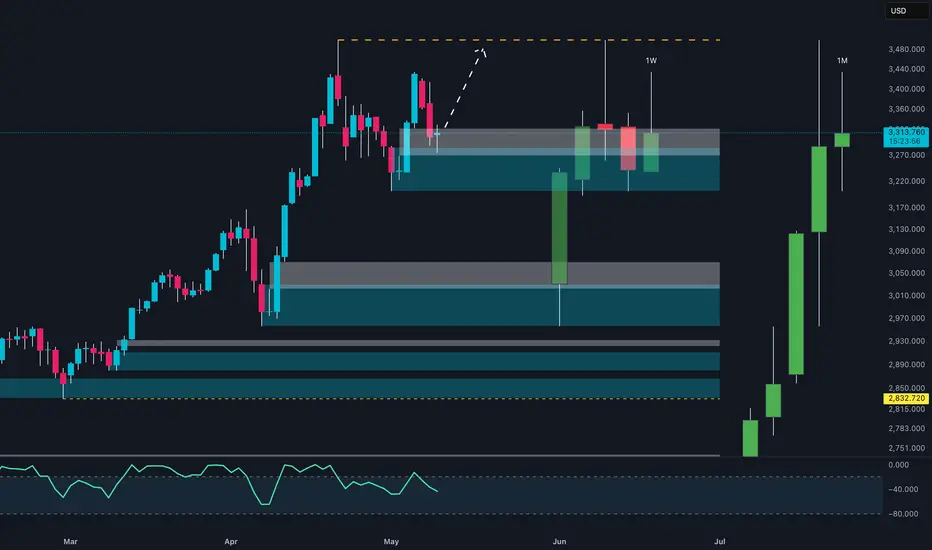
Technical Context:
The graphical analysis shows that the price of gold (XAU/USD) is currently consolidating within a significant demand zone following the recent bullish impulse. The daily chart shows an attempt to bounce off the 3,300 USD zone, a key psychological level.
Volume and COT Analysis:
The latest COT data (April 29, 2025) indicates a slight reduction in long positions by non-commercial operators (-18,519 contracts), balanced by an increase in commercial long positions (+1,659 contracts), signaling potential institutional accumulation.
On the retail sentiment front, traders are slightly more exposed to the downside (51% short vs. 49% long), which could indicate a potential short squeeze if the price resumes an upward trend.
Seasonal Trends:
According to data, May historically shows mixed performances with an average of +9.83% over the last 10 years, but with significant fluctuations between longer and more recent periods.
Key Levels:
Resistance: 3,380 - 3,400 USD (previous distribution zone)
Support: 3,300 USD (current demand zone) and 3,050 USD (secondary support)
Trading Strategy:
Bullish Scenario: Buy above 3,340 USD with a target at 3,400 USD and a stop loss below 3,300 USD.
Bearish Scenario: Sell below 3,300 USD with a target at 3,050 USD and a stop loss above 3,340 USD.
📈 Nicola | EdgeTradingJourney
Documenting my path to $1M in prop capital through real trading, discipline, and analysis.
Documenting my path to $1M in prop capital through real trading, discipline, and analysis.
Disclaimer
The information and publications are not meant to be, and do not constitute, financial, investment, trading, or other types of advice or recommendations supplied or endorsed by TradingView. Read more in the Terms of Use.