Hi everyone!
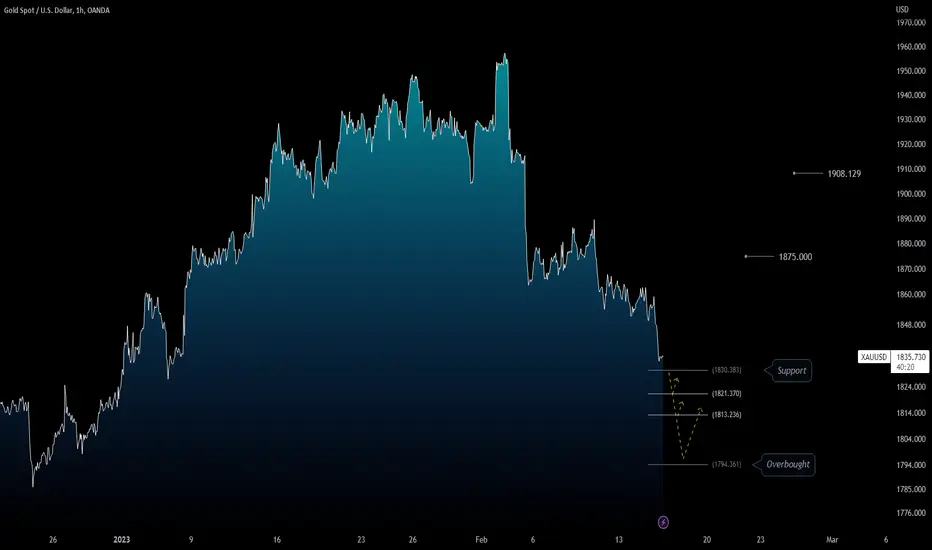
In short term, we have successfully followed this bearish price action (see chart below), but at the same time, we have reached an interesting mid term support area which could be used for some scalp trades or positioning.
That said, if volatility does appear, it will most likely be due to the retail sales figure expected in a few minutes.
On the hourly chart I have shown the technical levels that could be used (my favorites are the last two, especially the last one)... good luck!
OUR LAST SETUP
(Click and Play on Chart below)
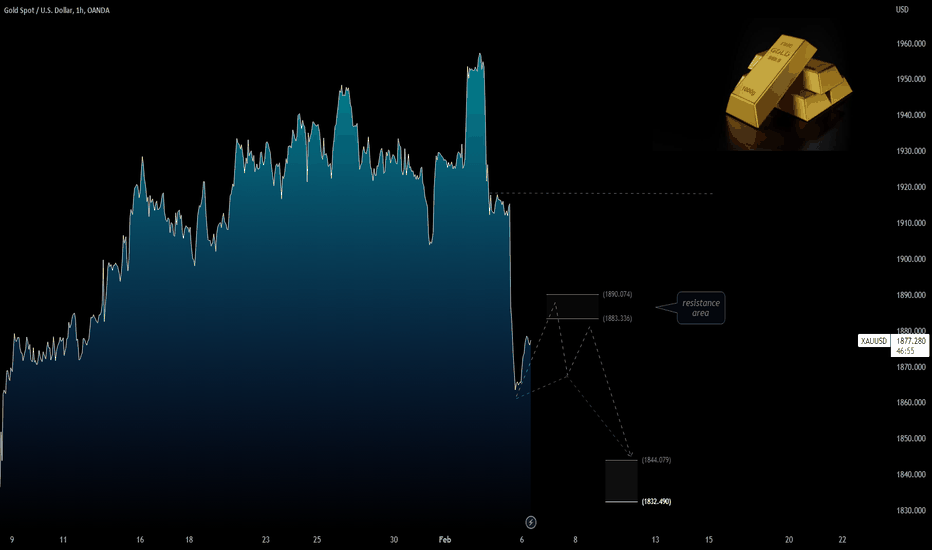
Note
Note
On chart I showed 1.794 level as overbought... error! I meant oversold... sorry! 😢Related publications
Disclaimer
The information and publications are not meant to be, and do not constitute, financial, investment, trading, or other types of advice or recommendations supplied or endorsed by TradingView. Read more in the Terms of Use.
Related publications
Disclaimer
The information and publications are not meant to be, and do not constitute, financial, investment, trading, or other types of advice or recommendations supplied or endorsed by TradingView. Read more in the Terms of Use.