📊 1. Market Structure Overview
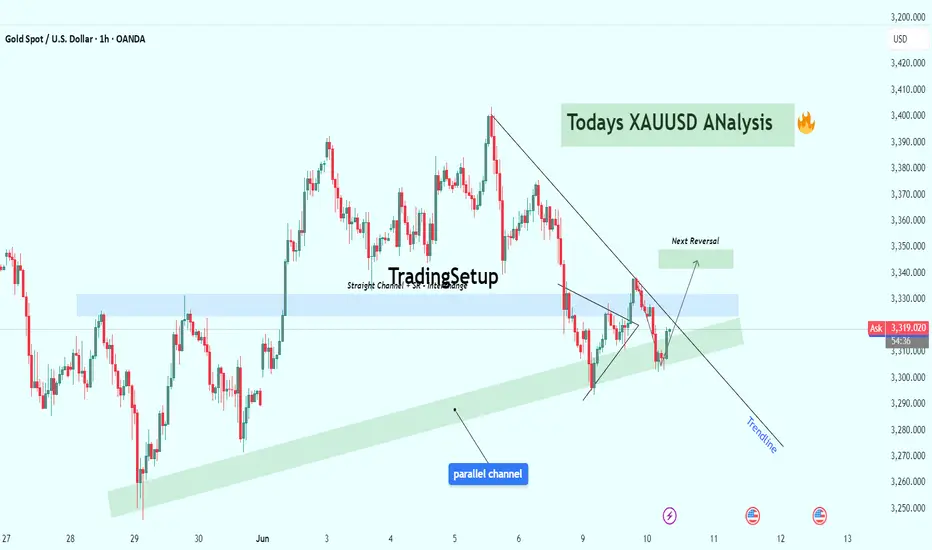
After a strong rally earlier this month, XAUUSD entered a corrective phase and formed a descending trendline which acted as resistance for multiple days. This trendline has just been tested and broken, suggesting that the correction may be coming to an end.
At the same time, price is showing signs of strength by bouncing off the lower boundary of a long-standing parallel ascending channel—a structure that has acted as dynamic support over the past two weeks.
🧱 2. Key Technical Elements
🟦 Support/Resistance Interchange Zone (S/R Flip)
Price recently interacted with a horizontal S/R interchange zone around the $3,310–$3,330 area.
This zone served as resistance during the earlier part of the trend and is now acting as support after the breakout.
It also overlaps with the mid-section of the ascending channel, adding confluence to this support area.
📐 Descending Trendline Break
The break above the descending trendline signals a potential shift in momentum.
Traders often view this kind of breakout as an early indicator of bullish continuation, especially when combined with volume or retests.
🟩 Next Reversal/Target Zone
A green box is highlighted around the $3,345–$3,355 zone, which could act as the next resistance or reversal level.
This is based on prior market structure and Fibonacci extension zones.
This area may offer a take-profit level for longs or a short-term reversal zone for countertrend traders.
🔍 3. What to Watch
✅ Bullish Scenario
If the price sustains above $3,310 and holds above the broken trendline, we could see a push toward the $3,345–$3,355 area.
Ideal long entries may occur on a retest of the trendline or the S/R flip zone, confirming it as support.
❌ Bearish Scenario
Failure to hold above the $3,300–$3,310 support region would invalidate the breakout.
A clean break below this zone could result in a drop back to the lower parallel channel boundary near $3,270 or even lower.
⚙️ 4. Trading Plan & Bias
Short-term Bias: Bullish (Trendline break + support hold)
Mid-term Bias: Cautiously Bullish (until major resistance is tested)
Risk Management: Stop-loss for long entries should be placed below $3,300 with targets near $3,345 and $3,355.
💬 Conclusion
This setup presents a classic case of trendline breakout + S/R flip confluence, which often leads to favorable risk/reward opportunities. Gold traders should monitor the retest behavior around current levels closely, as it will likely determine the next directional move.
📌 Always wait for confirmation, manage risk, and don’t chase moves—especially near major zones.
For Daily Trade Setups and Forecast: 📈 t.me/xauusdoptimizer
Premium Signals Fr33: 💯 t.me/xauusdoptimizer
🥰🥳🤩
Premium Signals Fr33: 💯 t.me/xauusdoptimizer
🥰🥳🤩
Related publications
Disclaimer
The information and publications are not meant to be, and do not constitute, financial, investment, trading, or other types of advice or recommendations supplied or endorsed by TradingView. Read more in the Terms of Use.