Dear Traders,
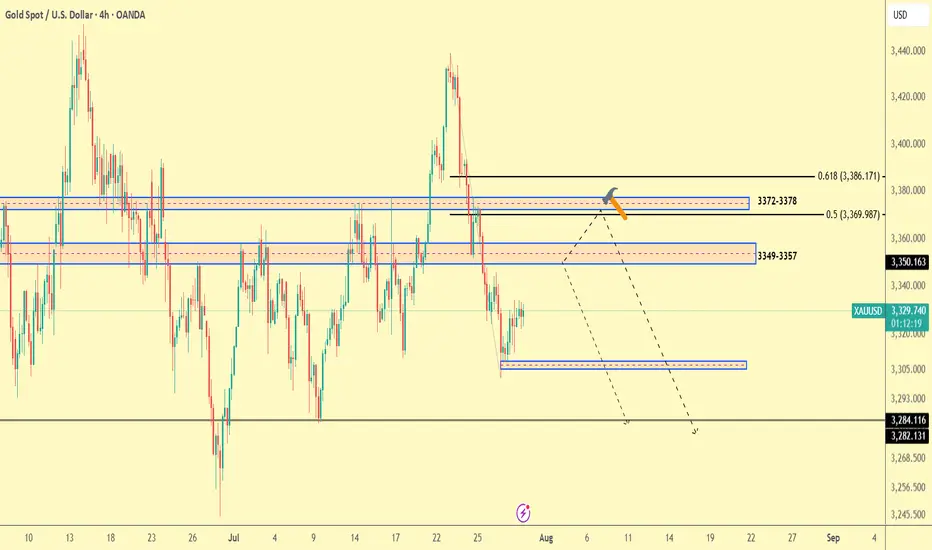
This chart represents the XAU/USD (Gold / U.S. Dollar) pair on a 4-hour timeframe. The market is showing a series of Fibonacci retracements and key levels, with potential price action zones marked for future movements.
Key Levels:
Resistance Zones: At 3,422.105 (near the green line), followed by the 3,386.171 level (Fibonacci 0.618).
Support Zones: Major support is visible near 3,282.131 (bottom of the chart), with additional minor support levels at 3,305.000 and 3,293.000.
Mid-range Support: Around 3,369.987.
Potential Price Action:
The price recently dropped from higher levels, breaking below the previous support levels. The market seems to be testing lower support zones.
A potential move down towards 3,284.116 or 3,282.131 is likely if the current support levels do not hold.
Conversely, if price action holds the current support zone (3,329.040), a retest of the higher resistance at 3,350.163 could occur.
Fibonacci Levels:
Retracement Levels: The Fibonacci retracement is drawn with key levels, particularly around 3,372-3,378 and 3,349-3,357, acting as strong support or resistance.
Extensions: There is potential for the price to move towards the 3,420 region if resistance levels break.
Strategy Suggestion:
Short Position: Targeting lower levels near 3,282.131 or 3,284.116.
Long Position: If price holds above 3,329.040, target resistance at 3,350.163 and beyond.
Regards,
Alireza!
💰MY FREE FOREX CRYPTO SIGNALS TELEGRAM CHANNEL: : t.me/Alirezaktrade
Disclaimer
The information and publications are not meant to be, and do not constitute, financial, investment, trading, or other types of advice or recommendations supplied or endorsed by TradingView. Read more in the Terms of Use.