📌 Core driving factors
Safe-haven demand support: The turbulent situation in Los Angeles, USA, stimulated short-term safe-haven buying, limiting the decline in gold prices.
Fed policy expectations: Last Friday (June 6), strong non-farm data (employment growth exceeded expectations) strengthened the expectation of "high interest rates for longer", the US dollar strengthened (closed at 99.20), and gold fell back to $3,310/ounce under pressure.
Technical selling pressure: Gold prices failed to stabilize after hitting a high of $3,402, and bulls took profits, forming a short-term top structure.
📊 Technical analysis
1. Weekly level
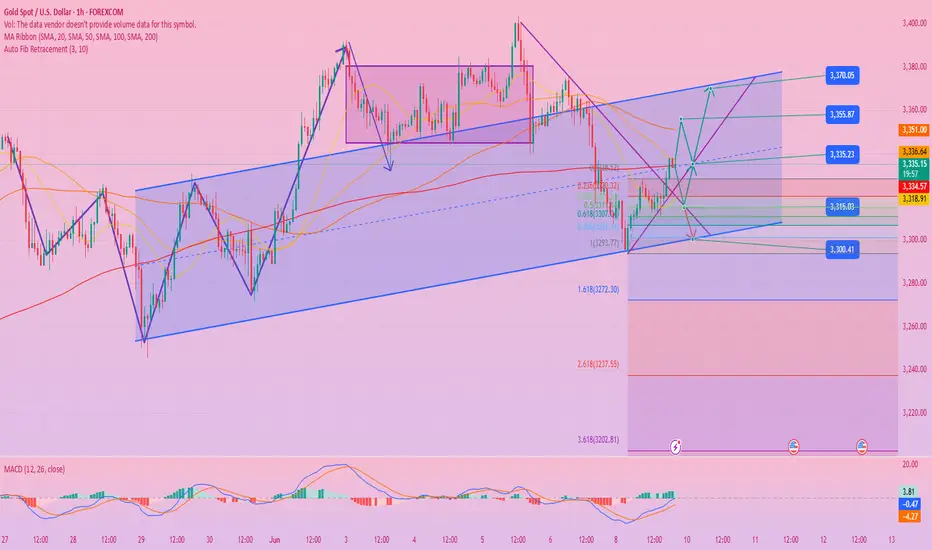
Long upper shadow cross: It shows that there is strong resistance in the $3,400 area. If it cannot break through this week, a double top pattern may be formed (neckline support 3280-3300).
Key resistance: $3,355 (last week's high); key support: $3,300 (psychological barrier).
2. Daily level
The second peak fell back: 3403 US dollars formed a double top pressure, MACD top divergence, and the short-term adjustment pressure increased.
Key watershed: 3310-3315 (the intraday long and short battle point), if it falls below, it will look down to 3280-3250.
3. 4-hour level
Trend break: Lost the rising trend line and the middle track 3330-3335, short-term weakness.
Bullish counterattack signal: If it stands firm at 3315 and breaks through 3330, it may test the 3350 resistance again.
🎯 Trading strategy suggestions
🔹 Short-term operation (intraday)
Long order opportunity: callback to 3300-3310 light position long, stop loss 3285, target 3335-3345.
Shorting opportunities: shorting at 3345-3355, stop loss at 3365, target at 3310-3300.
🔹 Mid-term layout
Double top confirmation: If the weekly line closes below 3300, consider mid-term shorting, target at 3250-3200.
Breakthrough signal: If it stands at 3355, the double top will be invalid, and the upward trend will be 3400-3450.
⚠️ Risk warning
Pay attention to the forward guidance of the Fed's June interest rate decision and changes in the geopolitical situation. If risk aversion heats up or inflation data weakens, the gold price may break through $3,400.
(Note: The market is changing rapidly, and it is recommended to dynamically adjust the strategy in combination with real-time data.)
Trade active
Gold market review:
Spot gold is trading around $3,340/ounce. Today, it opened at $3,327.38/ounce, and once dropped to $3,301.54/ounce in the Asian session, and then rebounded. The intraday decline was due to the rebound of the US dollar and the recovery of market risk appetite, which suppressed gold demand. After that, the weakening of the US dollar increased the attractiveness of gold; the tense situation in the region stimulated risk aversion; at the same time, the Fed's June meeting is approaching, and the expectation of interest rate cuts also constitutes support, which boosts the price of gold.
From a technical perspective:
❶: From the daily level: the Bollinger band is flat, and the gold price is running above the middle track of $3,303/ounce, in the range of $3,250-3,365. The 5- and 10-day moving averages are running in a golden cross, and the MACD and RSI double dead cross, and the short position is beginning to appear. Previously, the gold price rose and then pulled back, and now pay attention to the support of $3,300 and the resistance of $3,365.
❷: On the 4-hour level: the Bollinger Band opening has converged, and the gold price is running near the middle track of $3336/ounce. The MACD dead cross is closed, the downward momentum column is shortened, and the short momentum is weakened. The RSI golden cross is in the 49-57 range, and the long and short positions are in a stalemate.
❸: On the hourly level: the Bollinger Band opening is widened, and the gold price fluctuates above the middle track of $3323/ounce, suppressed by the upper track of $3343/ounce. The momentum of the MACD golden cross is enhanced, and the RSI golden cross is running at 52-75, and the short-term bulls are strong. Pay attention to the breakthrough of the $3340 resistance and the $3300 support.
Related publications
Disclaimer
The information and publications are not meant to be, and do not constitute, financial, investment, trading, or other types of advice or recommendations supplied or endorsed by TradingView. Read more in the Terms of Use.
Related publications
Disclaimer
The information and publications are not meant to be, and do not constitute, financial, investment, trading, or other types of advice or recommendations supplied or endorsed by TradingView. Read more in the Terms of Use.