📰 Impact of news:
1. The conflict between Russia and Ukraine breaks out again, exacerbating the uncertainty of the situation
2. The tension in the Middle East continues, Iran claims to be ready to defend its airspace at any time, and the Houthi armed forces attack Israeli airports
3. May PMI data released
📈 Market analysis:
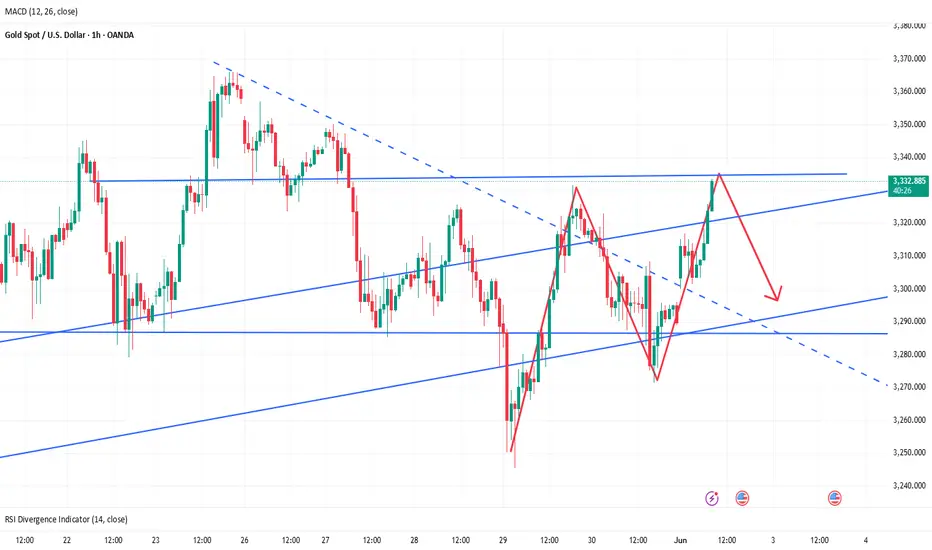
As geopolitical conflicts between Russia and Ukraine and the Middle East broke out again over the weekend, gold jumped higher today. From a technical perspective, the 1H chart shows a bullish arrangement, but the gold price is in a downward channel at the daily level. The gold price is currently near the middle track of the Bollinger Band and is obviously suppressed by the downward channel. The 4H level Bollinger Bands narrowed, the moving averages adhered, the long and short positions were in a stalemate, and the MACD indicator hovered around the 0 axis. 3330 - 3335 above is the key resistance area. If it breaks through 3340, it is expected to continue to see new highs. At the same time, there is short-term support in the 3285-3280 range below. 3270 - 3265 becomes the key important support. If it falls below, it may fall to 3245. For short-term operations in the Asian and European sessions today, if the resistance area of 3325-3335 cannot be effectively broken through, you can consider shorting and look towards 3310-3290 in the short term.
🏅 Trading strategies:
SELL 3325-3335
TP 3310-3290
If you agree with this view, or have a better idea, please leave a message in the comment area. I look forward to hearing different voices.
 GOLD XAUUSD XAUUSD XAUUSD XAUUSD
1. The conflict between Russia and Ukraine breaks out again, exacerbating the uncertainty of the situation
2. The tension in the Middle East continues, Iran claims to be ready to defend its airspace at any time, and the Houthi armed forces attack Israeli airports
3. May PMI data released
📈 Market analysis:
As geopolitical conflicts between Russia and Ukraine and the Middle East broke out again over the weekend, gold jumped higher today. From a technical perspective, the 1H chart shows a bullish arrangement, but the gold price is in a downward channel at the daily level. The gold price is currently near the middle track of the Bollinger Band and is obviously suppressed by the downward channel. The 4H level Bollinger Bands narrowed, the moving averages adhered, the long and short positions were in a stalemate, and the MACD indicator hovered around the 0 axis. 3330 - 3335 above is the key resistance area. If it breaks through 3340, it is expected to continue to see new highs. At the same time, there is short-term support in the 3285-3280 range below. 3270 - 3265 becomes the key important support. If it falls below, it may fall to 3245. For short-term operations in the Asian and European sessions today, if the resistance area of 3325-3335 cannot be effectively broken through, you can consider shorting and look towards 3310-3290 in the short term.
🏅 Trading strategies:
SELL 3325-3335
TP 3310-3290
If you agree with this view, or have a better idea, please leave a message in the comment area. I look forward to hearing different voices.
Trade active
The gold price is still rising rapidly, breaking through the 3340 line, which is in line with our expectations. However, from the hourly chart, the RSI indicator has entered the overbought area. This situation may not last too long in the short term. We still need to be vigilant about the risk of a decline. Therefore, after making enough profits, bros can consider leaving the market to ensure that they can obtain stable returns.Disclaimer
The information and publications are not meant to be, and do not constitute, financial, investment, trading, or other types of advice or recommendations supplied or endorsed by TradingView. Read more in the Terms of Use.
Disclaimer
The information and publications are not meant to be, and do not constitute, financial, investment, trading, or other types of advice or recommendations supplied or endorsed by TradingView. Read more in the Terms of Use.