There are many reasons. Brief description is time killing. So I'm giving you the summary. Find the reasons from the chart.
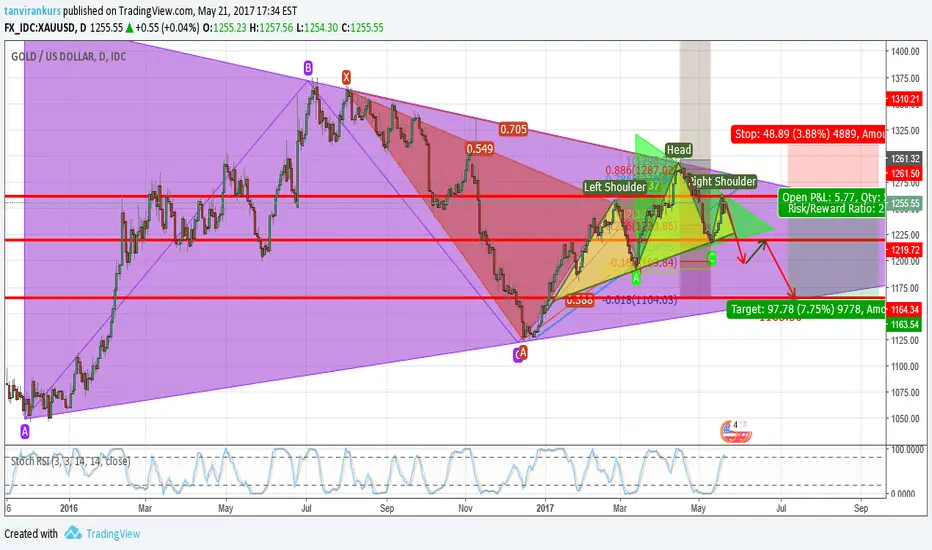
1. Weekly Triangle Resistance. (Purple)
2. Weekly Stoch-RSI "Over Bought"
3. Daily Triangle Resistance. (Lime-Green)
4. Daily Stoch-RSI "Over Bought".
5. "Bearish Bat" Harmonic Pattern. (Maroon)
6. Bearish "Head & Shoulders" Pattern. (Yellow)
7. 61.8% Fibonacci Retracement completed of most recent Daily down A-B boundary at confluence of resistance.
Trade active
+4600 PipsDisclaimer
The information and publications are not meant to be, and do not constitute, financial, investment, trading, or other types of advice or recommendations supplied or endorsed by TradingView. Read more in the Terms of Use.
Disclaimer
The information and publications are not meant to be, and do not constitute, financial, investment, trading, or other types of advice or recommendations supplied or endorsed by TradingView. Read more in the Terms of Use.