🔎 Market Narrative:
Today’s GOLD analysis is crafted through the lens of Mirror Market Concepts (MMC)—a powerful strategy where historical price behavior is mirrored in the current chart structure. This is combined with traditional structural analysis, offering a clear view of current price behavior, key breakouts, and target levels.
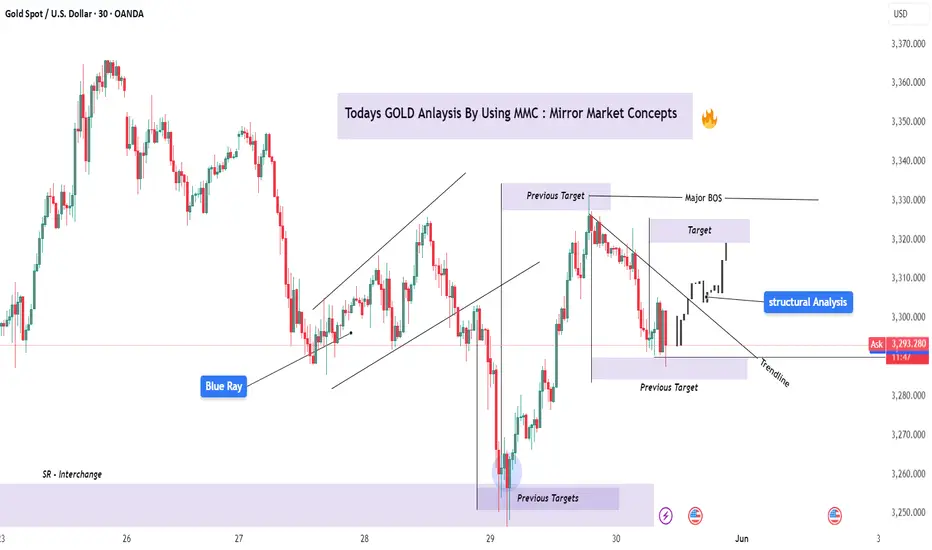
We’re currently seeing an interesting scenario unfold where the market structure is shifting from bearish to bullish, aligning with mirrored reactions from previous key zones.
🧠 MMC Breakdown & Price Psychology:
🔄 Mirror Reaction:
Notice how the market mirrored a previous aggressive sell-off with a similar bullish recovery. This “reflection” is a hallmark of MMC—where market sentiment repeats itself, but in opposite directions.
The "Previous Targets" zone acted as a key SR Interchange (support-turned-resistance / resistance-turned-support). Price dropped into this zone and bounced with strong bullish momentum, signaling smart money accumulation or potential liquidity grab before reversal.
🧱 Structural Analysis:
🔹 Trendline Observation:
A key trendline (drawn from the recent swing highs) was clearly broken, confirming that the bearish structure has shifted into a bullish one. The breakout was followed by a retest, further strengthening the validity of this move.
🔹 Support/Resistance Flip (SR Interchange Zone):
The Blue Ray zone marked on the chart is critical. This area held as support in the past and again acted as a launchpad for the recent upside move.
🔹 Previous Targets Reclaimed:
After hitting the previous support zone, price reversed sharply—another MMC principle in play. These zones often serve as liquidity magnets and reaction zones, where institutional traders are active.
📍 Key Levels To Watch:
✅ Current Support: $3,289–$3,295 (Previously broken resistance, now acting as support)
🎯 Immediate Target Zone: $3,310–$3,320
(This is where the price is expected to face short-term resistance. If broken, the next mirror move could extend further.)
🔻 Trendline Confirmation Level: $3,296
(Holding above this confirms bullish bias short-term)
🛠️ Trading Plan / Bias:
Bias: Bullish
Entry Idea: Look for bullish continuation above $3,296 after minor consolidation or retest
Risk Management: Place stop-loss just below $3,289 (previous demand zone)
Take-Profit: $3,310 – $3,320 zone initially
⚠️ Risk Consideration:
Gold can be volatile, especially during news events. Always assess macroeconomic factors (like Fed policy, NFP, CPI, etc.) and manage your trades with solid risk-to-reward ratios.
🧠 Final Thoughts:
This chart is a great example of how Mirror Market Concepts (MMC) can work hand-in-hand with price action and structure to provide clean, repeatable setups. By understanding the psychology behind price mirroring, we can better anticipate turning points and entry zones—especially when the structure confirms it.
Whether you’re a day trader or swing trader, this concept adds a layer of confluence to your technical analysis toolkit.
Today’s GOLD analysis is crafted through the lens of Mirror Market Concepts (MMC)—a powerful strategy where historical price behavior is mirrored in the current chart structure. This is combined with traditional structural analysis, offering a clear view of current price behavior, key breakouts, and target levels.
We’re currently seeing an interesting scenario unfold where the market structure is shifting from bearish to bullish, aligning with mirrored reactions from previous key zones.
🧠 MMC Breakdown & Price Psychology:
🔄 Mirror Reaction:
Notice how the market mirrored a previous aggressive sell-off with a similar bullish recovery. This “reflection” is a hallmark of MMC—where market sentiment repeats itself, but in opposite directions.
The "Previous Targets" zone acted as a key SR Interchange (support-turned-resistance / resistance-turned-support). Price dropped into this zone and bounced with strong bullish momentum, signaling smart money accumulation or potential liquidity grab before reversal.
🧱 Structural Analysis:
🔹 Trendline Observation:
A key trendline (drawn from the recent swing highs) was clearly broken, confirming that the bearish structure has shifted into a bullish one. The breakout was followed by a retest, further strengthening the validity of this move.
🔹 Support/Resistance Flip (SR Interchange Zone):
The Blue Ray zone marked on the chart is critical. This area held as support in the past and again acted as a launchpad for the recent upside move.
🔹 Previous Targets Reclaimed:
After hitting the previous support zone, price reversed sharply—another MMC principle in play. These zones often serve as liquidity magnets and reaction zones, where institutional traders are active.
📍 Key Levels To Watch:
✅ Current Support: $3,289–$3,295 (Previously broken resistance, now acting as support)
🎯 Immediate Target Zone: $3,310–$3,320
(This is where the price is expected to face short-term resistance. If broken, the next mirror move could extend further.)
🔻 Trendline Confirmation Level: $3,296
(Holding above this confirms bullish bias short-term)
🛠️ Trading Plan / Bias:
Bias: Bullish
Entry Idea: Look for bullish continuation above $3,296 after minor consolidation or retest
Risk Management: Place stop-loss just below $3,289 (previous demand zone)
Take-Profit: $3,310 – $3,320 zone initially
⚠️ Risk Consideration:
Gold can be volatile, especially during news events. Always assess macroeconomic factors (like Fed policy, NFP, CPI, etc.) and manage your trades with solid risk-to-reward ratios.
🧠 Final Thoughts:
This chart is a great example of how Mirror Market Concepts (MMC) can work hand-in-hand with price action and structure to provide clean, repeatable setups. By understanding the psychology behind price mirroring, we can better anticipate turning points and entry zones—especially when the structure confirms it.
Whether you’re a day trader or swing trader, this concept adds a layer of confluence to your technical analysis toolkit.
For Daily Trade Setups and Forecast: 📈 t.me/xauusdoptimizer
Premium Signals Fr33: 💯 t.me/xauusdoptimizer
🥰🥳🤩
Premium Signals Fr33: 💯 t.me/xauusdoptimizer
🥰🥳🤩
Related publications
Disclaimer
The information and publications are not meant to be, and do not constitute, financial, investment, trading, or other types of advice or recommendations supplied or endorsed by TradingView. Read more in the Terms of Use.