✅ Daily Chart: Gold prices remain within a consolidation range, with 3380–3400 as the key resistance zone and 3350–3355 as the critical support area. During the U.S. session, there is slight upward momentum; if 3380–3400 is broken, it could open further upside potential.
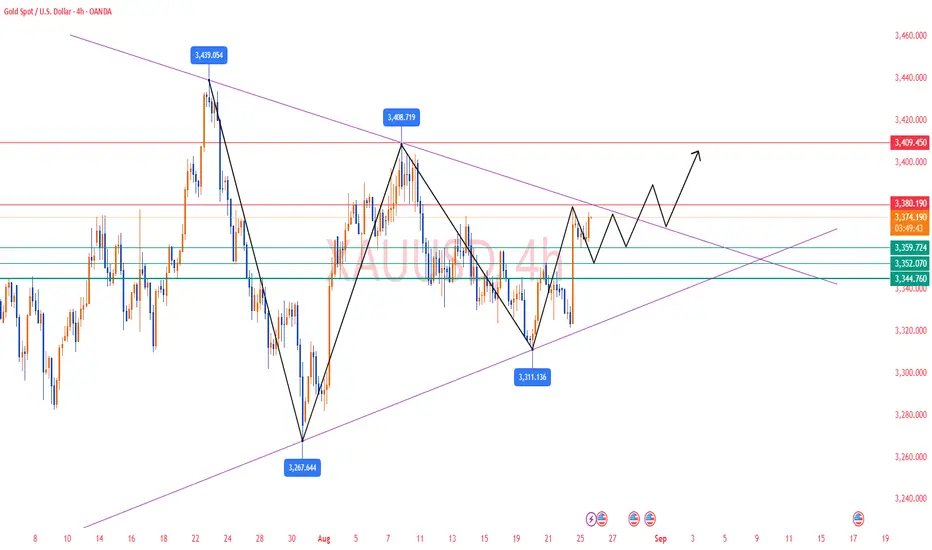
✅ 4-Hour Chart: After forming a bottom in the 3311–3321 region, gold rebounded strongly to a high of 3378 and is now consolidating at higher levels. MA5 is turning upward, with MA10 and MA20 following, confirming a short-term bullish trend. MACD shows a bullish crossover with expanding red bars, indicating sustained bullish momentum. KDJ is at high levels but showing signs of a possible pullback. The overall bullish structure remains intact, but caution is needed if resistance at 3380–3400 triggers a short-term retracement.
✅ 1-Hour Chart: Gold is fluctuating between 3360–3380, with MA5, MA10, and MA20 intertwined. Price action is sticking close to short-term moving averages, reflecting a tug-of-war between bulls and bears. MACD red bars are shrinking, signaling weakening momentum, while KDJ is overbought and may form a bearish crossover, suggesting a possible short-term pullback. The 3360 support level must be watched closely.
🔴 Resistance Levels: 3380–3400
🟢 Support Levels: 3355–3350
✅ Trading Strategy Reference:
🔰 If price faces clear resistance at 3380–3400, consider light short positions with targets at 3360–3350.
🔰 If price stabilizes and rebounds from 3350–3355, consider light long positions, stop-loss below 3344, targeting 3380–3390.
🔰 If price breaks above 3400 with strong volume, consider buying after a pullback to 3380–3390, aiming for 3420–3450.
✅ Conclusion: Gold is currently in a range-bound but bullish-biased structure. The medium-term bullish trend remains intact, but short-term price action will depend on whether gold can break above the 3380–3400 resistance zone or maintain support at 3360–3350.
Trade active
Gold's early trading performance was exactly the same as our analysis. It fell back to the 3351 support level and then quickly rose to around 3386, with a profit of nearly ++350 pips👏👏👏✅𝐃𝐚𝐢𝐥𝐲 𝟐-𝟒 𝐓𝐫𝐚𝐝𝐢𝐧𝐠 𝐒𝐢𝐠𝐧𝐚𝐥𝐬🔥
✅𝐇𝐢𝐠𝐡 𝐀𝐜𝐜𝐮𝐫𝐚𝐜𝐲 𝟗𝟎%-𝟗𝟓% 🔥
✅𝐖𝐞𝐞𝐤𝐥𝐲 𝐲𝐢𝐞𝐥𝐝 𝟔𝟎%-𝟖𝟓%🔥
👉Free Channel:t.me/+AMHhMKEIj_IzN2Vl
✉️VIP Guidance : t.me/Jack_blackwell
✅𝐇𝐢𝐠𝐡 𝐀𝐜𝐜𝐮𝐫𝐚𝐜𝐲 𝟗𝟎%-𝟗𝟓% 🔥
✅𝐖𝐞𝐞𝐤𝐥𝐲 𝐲𝐢𝐞𝐥𝐝 𝟔𝟎%-𝟖𝟓%🔥
👉Free Channel:t.me/+AMHhMKEIj_IzN2Vl
✉️VIP Guidance : t.me/Jack_blackwell
Disclaimer
The information and publications are not meant to be, and do not constitute, financial, investment, trading, or other types of advice or recommendations supplied or endorsed by TradingView. Read more in the Terms of Use.
✅𝐃𝐚𝐢𝐥𝐲 𝟐-𝟒 𝐓𝐫𝐚𝐝𝐢𝐧𝐠 𝐒𝐢𝐠𝐧𝐚𝐥𝐬🔥
✅𝐇𝐢𝐠𝐡 𝐀𝐜𝐜𝐮𝐫𝐚𝐜𝐲 𝟗𝟎%-𝟗𝟓% 🔥
✅𝐖𝐞𝐞𝐤𝐥𝐲 𝐲𝐢𝐞𝐥𝐝 𝟔𝟎%-𝟖𝟓%🔥
👉Free Channel:t.me/+AMHhMKEIj_IzN2Vl
✉️VIP Guidance : t.me/Jack_blackwell
✅𝐇𝐢𝐠𝐡 𝐀𝐜𝐜𝐮𝐫𝐚𝐜𝐲 𝟗𝟎%-𝟗𝟓% 🔥
✅𝐖𝐞𝐞𝐤𝐥𝐲 𝐲𝐢𝐞𝐥𝐝 𝟔𝟎%-𝟖𝟓%🔥
👉Free Channel:t.me/+AMHhMKEIj_IzN2Vl
✉️VIP Guidance : t.me/Jack_blackwell
Disclaimer
The information and publications are not meant to be, and do not constitute, financial, investment, trading, or other types of advice or recommendations supplied or endorsed by TradingView. Read more in the Terms of Use.