Current Price Range: 3340 – 3350 USD
Trend Bias: Strong Bullish
Time Frame Focus: Intraday to Short-Term (H1/H4)
---
Price Structure & Trend
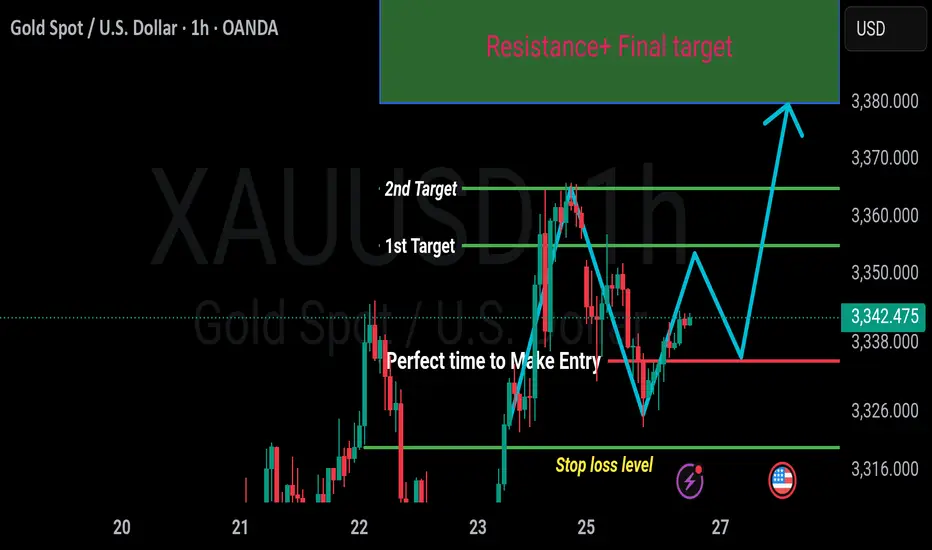
Gold is currently consolidating within a narrow range of 3340 to 3350, forming a bullish continuation pattern (likely a flag or a pennant). The current consolidation is occurring after a strong bullish impulse, which signals a potential for trend continuation to the upside.
This behavior is consistent with accumulation before breakout, often seen in trending markets. The presence of higher highs and higher lows on the H1 and H4 charts supports the bullish bias.
---
Key Levels
Zone Level Significance
Support 3335 Pullback zone / Potential entry area
Minor Support 3320 Stop loss zone / Break of structure risk
Resistance 1 3365 Initial profit target / minor resistance
Resistance 2 3375 Midway resistance / partial exit level
Major Resistance 3380–3400 Final target zone / Strong supply area
---
Entry & Setup
Entry Zone: 3335–3355 (ideal is a retest of 3335 with confirmation candle)
Entry Type: Long (Buy) on support retest + bullish candle confirmation (pin bar, engulfing, etc.)
Stop Loss: Below 3320 (tight risk, below structure support)
Take Profits:
TP1: 3365
TP2: 3375
TP3: 3400 (final target)
Risk:Reward Ratio (Approximate):
From entry at 3335: R:R = 1:2.5 to 1:3.5 depending on target
From entry at 3350: R:R = 1:1.5 to 1:2.5
---
Technical Indicators
RSI: Likely in the 55–65 zone on H1/H4, indicating strength but not yet overbought.
MACD: Histogram positive, signal line above zero, supporting bullish momentum.
Volume: Look for rising volume on bullish candles and low volume on pullbacks.
---
Chart Patterns & Observations
Bullish Flag / Pennant: Suggests a continuation of the prior bullish move.
No bearish divergence observed (if indicators used).
Trendline support: Can draw ascending trendline connecting recent swing lows.
---
Conclusion & Strategy
Gold remains in a bullish phase with clear consolidation before potential breakout. Best opportunity is a buy on dip, ideally on a clean retest of 3335–3340 support zone with proper confirmation.
If gold breaks above 3355–3360 with momentum, aggressive traders may consider a breakout entry with reduced risk and tighter stops below 3340.
Avoid entries below 3320 as this would invalidate the bullish structure and may indicate a shift in trend.
Trend Bias: Strong Bullish
Time Frame Focus: Intraday to Short-Term (H1/H4)
---
Price Structure & Trend
Gold is currently consolidating within a narrow range of 3340 to 3350, forming a bullish continuation pattern (likely a flag or a pennant). The current consolidation is occurring after a strong bullish impulse, which signals a potential for trend continuation to the upside.
This behavior is consistent with accumulation before breakout, often seen in trending markets. The presence of higher highs and higher lows on the H1 and H4 charts supports the bullish bias.
---
Key Levels
Zone Level Significance
Support 3335 Pullback zone / Potential entry area
Minor Support 3320 Stop loss zone / Break of structure risk
Resistance 1 3365 Initial profit target / minor resistance
Resistance 2 3375 Midway resistance / partial exit level
Major Resistance 3380–3400 Final target zone / Strong supply area
---
Entry & Setup
Entry Zone: 3335–3355 (ideal is a retest of 3335 with confirmation candle)
Entry Type: Long (Buy) on support retest + bullish candle confirmation (pin bar, engulfing, etc.)
Stop Loss: Below 3320 (tight risk, below structure support)
Take Profits:
TP1: 3365
TP2: 3375
TP3: 3400 (final target)
Risk:Reward Ratio (Approximate):
From entry at 3335: R:R = 1:2.5 to 1:3.5 depending on target
From entry at 3350: R:R = 1:1.5 to 1:2.5
---
Technical Indicators
RSI: Likely in the 55–65 zone on H1/H4, indicating strength but not yet overbought.
MACD: Histogram positive, signal line above zero, supporting bullish momentum.
Volume: Look for rising volume on bullish candles and low volume on pullbacks.
---
Chart Patterns & Observations
Bullish Flag / Pennant: Suggests a continuation of the prior bullish move.
No bearish divergence observed (if indicators used).
Trendline support: Can draw ascending trendline connecting recent swing lows.
---
Conclusion & Strategy
Gold remains in a bullish phase with clear consolidation before potential breakout. Best opportunity is a buy on dip, ideally on a clean retest of 3335–3340 support zone with proper confirmation.
If gold breaks above 3355–3360 with momentum, aggressive traders may consider a breakout entry with reduced risk and tighter stops below 3340.
Avoid entries below 3320 as this would invalidate the bullish structure and may indicate a shift in trend.
Disclaimer
The information and publications are not meant to be, and do not constitute, financial, investment, trading, or other types of advice or recommendations supplied or endorsed by TradingView. Read more in the Terms of Use.
Disclaimer
The information and publications are not meant to be, and do not constitute, financial, investment, trading, or other types of advice or recommendations supplied or endorsed by TradingView. Read more in the Terms of Use.