Over the past two trading sessions, gold has depreciated more than 1.5%, as a consistent bearish bias begins to emerge in price action. For now, selling pressure has remained steady, supported by a temporary decline in global economic uncertainty and a recent rebound in U.S. dollar strength, factors that have led gold’s upward momentum to steadily weaken.
Lateral Range Remains Intact
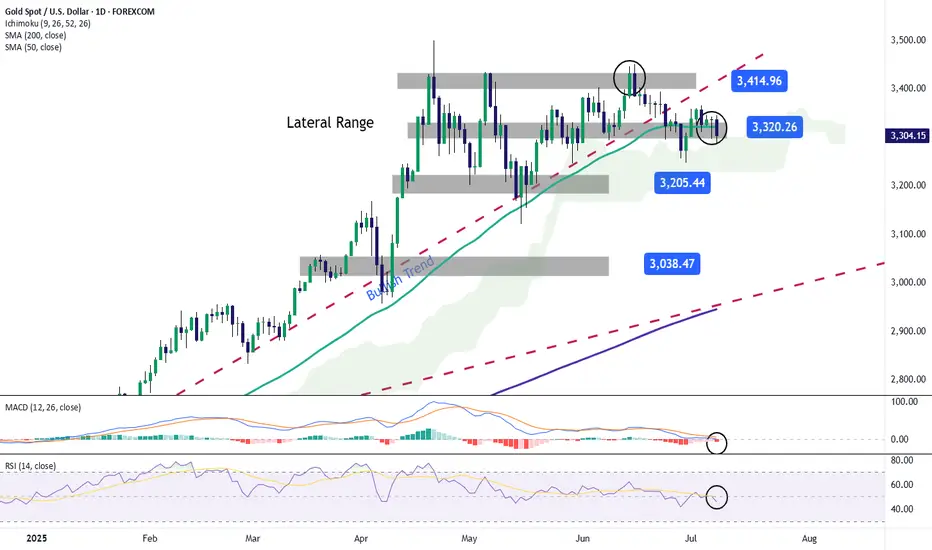
Recent price action in gold has defined a well-established sideways channel, with resistance near $3,400 and support around $3,200 per ounce. So far, price movement has been insufficient to break out of this range, making it the most relevant technical structure to monitor in the short term. As long as price remains within these boundaries, neutrality may continue to dominate.
Technical Indicators
MACD: The MACD indicator continues to oscillate near the neutral zero line, signaling that momentum from moving averages remains balanced. If this pattern persists, the sideways range could extend further.
RSI: A similar pattern is unfolding with the RSI, which is hovering around the 50 level, indicating a constant balance between buying and selling pressure. Sustained moves at this level could reinforce short-term price neutrality.
Key Levels to Watch:
Written by Julian Pineda, CFA – Market Analyst
Lateral Range Remains Intact
Recent price action in gold has defined a well-established sideways channel, with resistance near $3,400 and support around $3,200 per ounce. So far, price movement has been insufficient to break out of this range, making it the most relevant technical structure to monitor in the short term. As long as price remains within these boundaries, neutrality may continue to dominate.
Technical Indicators
MACD: The MACD indicator continues to oscillate near the neutral zero line, signaling that momentum from moving averages remains balanced. If this pattern persists, the sideways range could extend further.
RSI: A similar pattern is unfolding with the RSI, which is hovering around the 50 level, indicating a constant balance between buying and selling pressure. Sustained moves at this level could reinforce short-term price neutrality.
Key Levels to Watch:
- $3,400 per ounce: This historical high acts as the most significant resistance in the short term. A breakout above this level could trigger a stronger bullish bias and revive the upward trend stalled in recent weeks.
- $3,300 per ounce: The current level aligns with the 50-period simple moving average. Price movement around this zone could extend market neutrality.
- $3,200 per ounce: A key support level and recent low. A retest of this area could trigger a more decisive bearish bias in the short term.
Written by Julian Pineda, CFA – Market Analyst
Disclaimer
The information and publications are not meant to be, and do not constitute, financial, investment, trading, or other types of advice or recommendations supplied or endorsed by TradingView. Read more in the Terms of Use.
Disclaimer
The information and publications are not meant to be, and do not constitute, financial, investment, trading, or other types of advice or recommendations supplied or endorsed by TradingView. Read more in the Terms of Use.