Overall Trend:
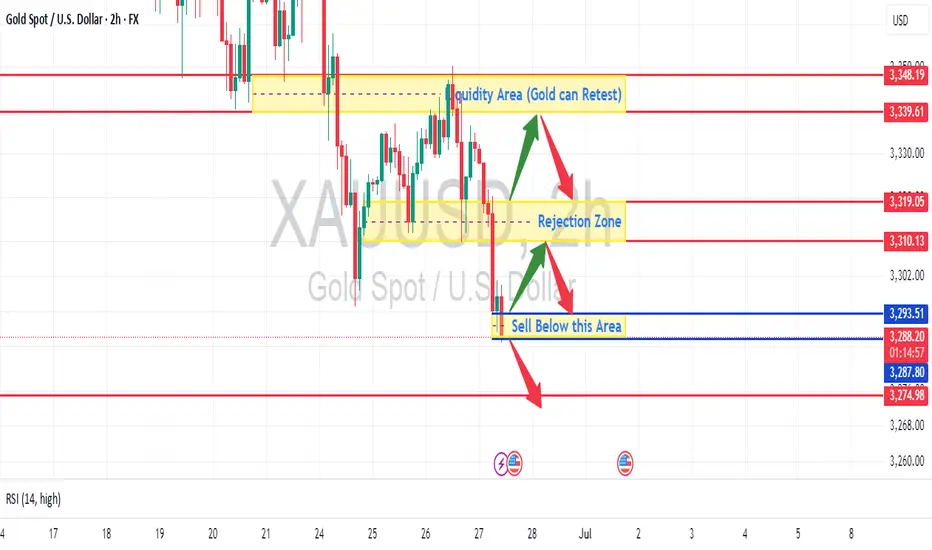
The chart shows that Gold (XAUUSD) has been in a downtrend over the depicted period, particularly after a significant drop around June 24th/25th from the higher price levels (around 3348-3350). While there have been attempts at recovery, the price has generally been making lower highs and lower lows, indicating bearish momentum.
Key Observations and Potential Entry Points:
Liquidity Area (Resistance/Potential Retest Zone):-The yellow shaded area marked "Liquidity Area (Gold can Retest)" between approximately 3330 and 3348 acted as a strong resistance zone after the initial drop.
Potential Entry (Short): If the price were to rally back into this "Liquidity Area" and show clear signs of rejection (e.g., bearish candlestick patterns like pin bars, engulfing patterns, or failure to break above it), it would be a strong point to consider a short (sell) entry. The red arrow indicates this possibility.
Rejection Zone (Current Resistance): - The yellow shaded area marked "Rejection Zone" around 3310-3319 is currently acting as a significant resistance. The price has attempted to break above it multiple times and has been rejected.
Potential Entry (Short): This area also presents a potential short (sell) entry if the price retests it and shows clear signs of rejection. The current candle is below this zone, indicating the rejection has already occurred.
"Sell Below this Area" (Breakdown Point):- The blue shaded area around 3293.51 - 3287.80 is highlighted as a critical support level.
Strong Point to Enter Trade (Short):- The chart explicitly labels this as "Sell Below this Area." If the price breaks convincingly below this support level (with strong bearish candle close below and follow-through), it would be a high-conviction short (sell) entry point. This indicates a potential continuation of the downtrend to lower targets. The red arrow signifies this downward move.
RSI (Relative Strength Index):- The RSI (14) is currently at 28.33. This indicates that Gold is approaching or is in oversold territory. While oversold conditions can sometimes precede a bounce, in a strong downtrend, prices can remain oversold for extended periods. It's crucial to combine RSI with price action. If the price breaks below the "Sell Below this Area" with an already oversold RSI, it might suggest a strong bearish momentum overwhelming any immediate bounce.
Trade Entry Strategy Summary:
Aggressive Short Entry: Consider a short if the price retests the "Rejection Zone" (3310-3319) or the higher "Liquidity Area" (3330-3348) and shows clear bearish rejection.
Confirmation Short Entry (Strongest Signal): The most robust short entry highlighted is a confirmed break and close below the "Sell Below this Area" (3293.51 - 3287.80). This would signal a continuation of the bearish momentum.
Important Considerations:
Risk Management: Always define your stop-loss order (e.g., above the rejection zone or above the breakdown level) to limit potential losses.
Target Levels: While not explicitly marked with targets, after a breakdown, look for previous swing lows or significant psychological levels as potential profit targets. The red line at 3274.98 could be an initial target if the "Sell Below this Area" is breached.
Confirmation: Always wait for candlestick confirmation (e.g., a strong bearish close) before entering a trade.
Timeframe: This is a 2-hour chart. The analysis is valid for this timeframe, but always consider higher timeframes for broader trend confirmation.
News/Fundamentals: While this is a technical analysis, be aware of any upcoming economic news or events that could impact Gold prices.
In conclusion, the chart strongly suggests a bearish bias for Gold, with key resistance zones above and a critical support level below that, if broken, could lead to further significant downside.
Disclaimer Warning - Do your own research before trading in Gold, we are not responsible for your loss...
Disclaimer
The information and publications are not meant to be, and do not constitute, financial, investment, trading, or other types of advice or recommendations supplied or endorsed by TradingView. Read more in the Terms of Use.
Disclaimer
The information and publications are not meant to be, and do not constitute, financial, investment, trading, or other types of advice or recommendations supplied or endorsed by TradingView. Read more in the Terms of Use.