🟨 Technical Analysis – Gold (XAU/USD)
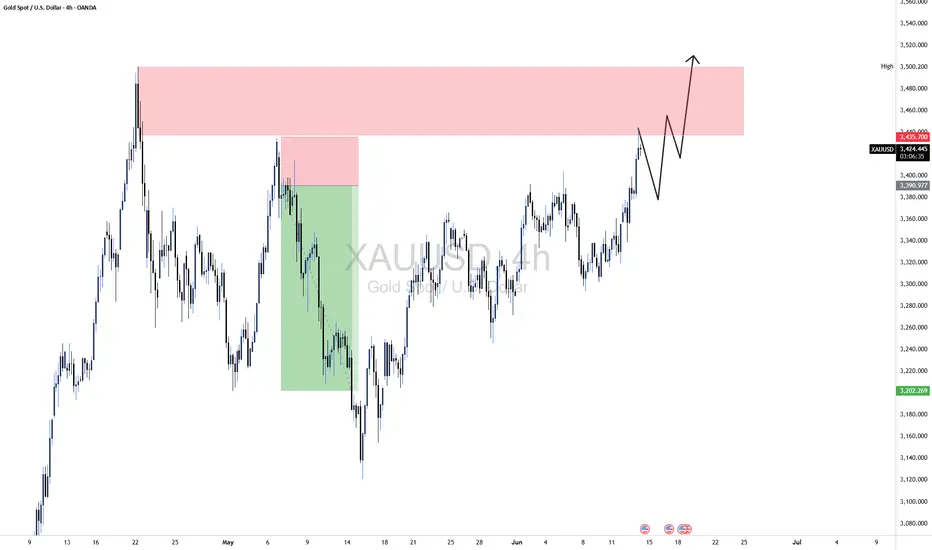
Gold has rallied strongly into a significant supply zone (resistance) marked in red, spanning approximately the $3,445 – $3,500 range. This area aligns with:
A previous major distribution zone where a sharp bearish move initiated (highlighted with the green selloff).
A clear liquidity pool, where institutional sell orders likely sit.
Bearish order block from early May, now being re-tested.
However, price action shows bullish momentum into this resistance, suggesting a potential re-accumulation rather than rejection.
The projected price path (black arrow) on the chart indicates a temporary pullback followed by a break above the resistance, confirming bullish continuation.
📰 Macro + Geopolitical Overlay – Bullish Gold Bias
Despite hitting resistance, fundamental drivers support further upside in gold:
Tensions between Israel and Iran have escalated again, with recent reports of military strikes and retaliatory threats.
Investors often seek safe-haven assets like gold during such periods of global instability.
These geopolitical risks amplify market uncertainty, often leading to capital flight from risk assets (e.g., equities, currencies) into gold.
Central banks and institutions may increase holdings in gold to hedge against volatility and inflation, especially amid broader Middle East unrest.
✅ Conclusion
While the chart shows gold approaching a critical resistance zone, the contextual news catalyst (Israel-Iran conflict) is likely to:
Fuel further bullish momentum, allowing price to break above $3,500 after a minor pullback.
Encourage short-term dip buying, especially if price retests around the $3,400–3,420 region.
📌 Expectation: A short-term consolidation or retracement inside the red zone, followed by a bullish breakout if geopolitical tensions persist.
Looking for powerful AI trading signals? Visit ProSignal.ai and take your trading to the next level! or join our telegram channel at t.me/prosignalai
Disclaimer
The information and publications are not meant to be, and do not constitute, financial, investment, trading, or other types of advice or recommendations supplied or endorsed by TradingView. Read more in the Terms of Use.