Gold Price Declines Amid Easing Geopolitical Tensions
It has been announced that a meeting between the Presidents of the United States and Russia will take place this week. Donald Trump and Vladimir Putin are expected to meet in Alaska. This will mark the first face-to-face talks between the leaders of the two major powers since 2021, when Putin met with Biden in Geneva.
The upcoming meeting is widely seen as a potential step towards ending the full-scale military conflict in Ukraine, which began in 2022. Anticipation of the talks is easing geopolitical tensions, which is reflected in today’s downward movement of the gold price, visible on the XAU/USD chart.

XAU/USD Technical Analysis
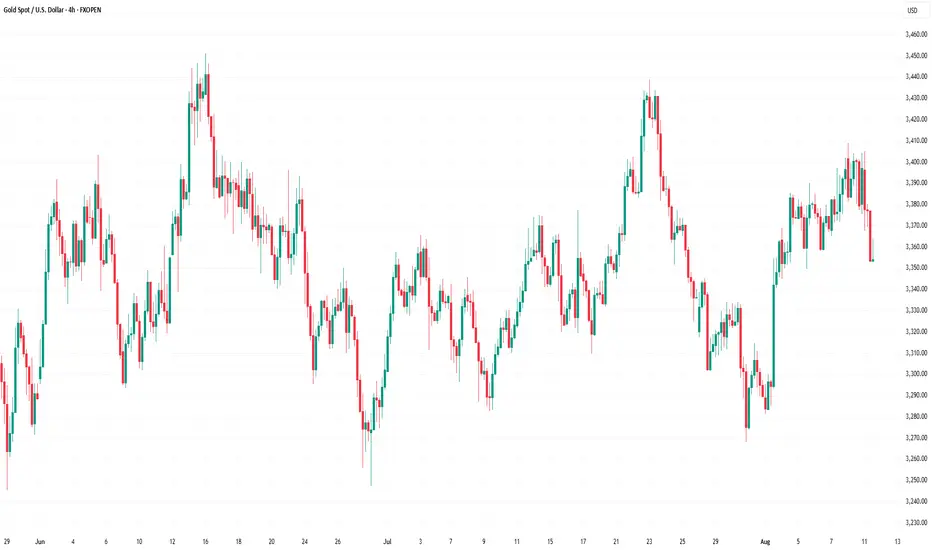
Today, gold prices have fallen to the $3,360 area, with several bearish signals apparent on the chart:
→ The decline occurred on long bearish candles (as shown by the arrow). From a price action perspective, this suggests mounting selling pressure.
→ The MACD histogram has moved below zero, with the indicator lines pointing downward.
→ Gold has broken the upward trendline support from above (marked in blue). The breakout level, around $3,380, may now act as resistance, as sellers have asserted their dominance here.
→ From a broader perspective, the price appears to be reversing from the resistance line drawn through this summer’s highs.
Given these factors,we could assume that gold is heading towards the lower black trendline, which runs through the notable July lows and forms a channel with the upper line. However, along the way, sellers will need to overcome a key support zone in the form of a bullish Fair Value Gap (marked in purple). The upper boundary of this zone is reinforced by the 50% Fibonacci retracement level plotted from the bullish impulse points A→B.
Whether the bears can push the price through the FVG zone will largely depend on gold’s reaction to tomorrow’s US inflation data (CPI release scheduled for 15:30 GMT+3).
This article represents the opinion of the Companies operating under the FXOpen brand only. It is not to be construed as an offer, solicitation, or recommendation with respect to products and services provided by the Companies operating under the FXOpen brand, nor is it to be considered financial advice.
It has been announced that a meeting between the Presidents of the United States and Russia will take place this week. Donald Trump and Vladimir Putin are expected to meet in Alaska. This will mark the first face-to-face talks between the leaders of the two major powers since 2021, when Putin met with Biden in Geneva.
The upcoming meeting is widely seen as a potential step towards ending the full-scale military conflict in Ukraine, which began in 2022. Anticipation of the talks is easing geopolitical tensions, which is reflected in today’s downward movement of the gold price, visible on the XAU/USD chart.
XAU/USD Technical Analysis
Today, gold prices have fallen to the $3,360 area, with several bearish signals apparent on the chart:
→ The decline occurred on long bearish candles (as shown by the arrow). From a price action perspective, this suggests mounting selling pressure.
→ The MACD histogram has moved below zero, with the indicator lines pointing downward.
→ Gold has broken the upward trendline support from above (marked in blue). The breakout level, around $3,380, may now act as resistance, as sellers have asserted their dominance here.
→ From a broader perspective, the price appears to be reversing from the resistance line drawn through this summer’s highs.
Given these factors,we could assume that gold is heading towards the lower black trendline, which runs through the notable July lows and forms a channel with the upper line. However, along the way, sellers will need to overcome a key support zone in the form of a bullish Fair Value Gap (marked in purple). The upper boundary of this zone is reinforced by the 50% Fibonacci retracement level plotted from the bullish impulse points A→B.
Whether the bears can push the price through the FVG zone will largely depend on gold’s reaction to tomorrow’s US inflation data (CPI release scheduled for 15:30 GMT+3).
This article represents the opinion of the Companies operating under the FXOpen brand only. It is not to be construed as an offer, solicitation, or recommendation with respect to products and services provided by the Companies operating under the FXOpen brand, nor is it to be considered financial advice.
Disclaimer
The information and publications are not meant to be, and do not constitute, financial, investment, trading, or other types of advice or recommendations supplied or endorsed by TradingView. Read more in the Terms of Use.
Disclaimer
The information and publications are not meant to be, and do not constitute, financial, investment, trading, or other types of advice or recommendations supplied or endorsed by TradingView. Read more in the Terms of Use.