SMC trading point update
Technical analysis of (XAU/USD) on a short-term timeframe, incorporating several key tools and concepts:
---
Overview of the Analysis
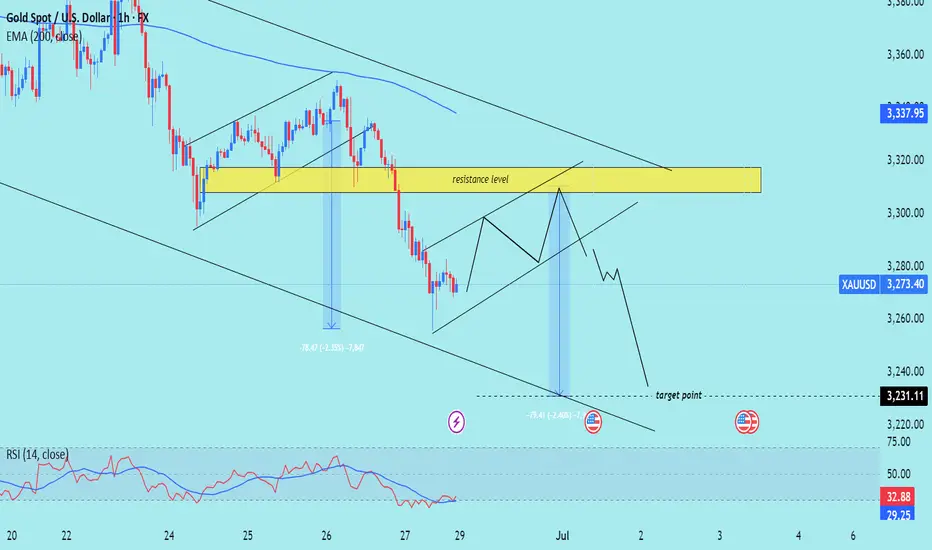
Price Level (Current): Around $3,273.40
EMA 200 (Blue Line): Around $3,337.95 (signaling broader trend)
Resistance Zone (Yellow Box): Between approximately $3,300–$3,320
Support/Target Zone: Around $3,231.11
RSI (Relative Strength Index): At 32.88, which is near oversold territory (below 30)
---
Interpretation of Chart Structure
1. Descending Channel:
Price is moving within a downward-sloping channel.
Suggests a bearish trend is in play.
2. Resistance Level (Yellow Box):
Price is expected to retest this area and face resistance.
Confluence of a supply zone and upper trendline, reinforcing its strength.
3. Projected Price Action:
Price may climb back up into the resistance zone.
A rejection is anticipated, leading to another leg down.
The target is around $3,231.11, which matches previous measured moves.
4. Measured Moves (Blue Arrows):
Highlights historical price drops of ~79 points.
Repeating this pattern suggests symmetry and continuation.
5. RSI Indicator:
Currently at 32.88: nearing oversold, but not quite.
No clear bullish divergence, so price could drop further.
---
Trade Idea Summary
Bias: Bearish
Entry Zone: Near $3,300–$3,320 (resistance)
Target: Around $3,231.11
Invalidation: If price breaks and holds above $3,337–$3,340 (EMA 200 and channel breakout)
Mr SMC Trading point
---
Caution/Considerations
Watch for false breakouts above the resistance zone.
Monitor RSI for potential bullish divergence that could invalidate the downside.
Be cautious around the U.S. economic news event icon, which might cause volatility.
plesse support boost 🚀 this analysis)
Technical analysis of (XAU/USD) on a short-term timeframe, incorporating several key tools and concepts:
---
Overview of the Analysis
Price Level (Current): Around $3,273.40
EMA 200 (Blue Line): Around $3,337.95 (signaling broader trend)
Resistance Zone (Yellow Box): Between approximately $3,300–$3,320
Support/Target Zone: Around $3,231.11
RSI (Relative Strength Index): At 32.88, which is near oversold territory (below 30)
---
Interpretation of Chart Structure
1. Descending Channel:
Price is moving within a downward-sloping channel.
Suggests a bearish trend is in play.
2. Resistance Level (Yellow Box):
Price is expected to retest this area and face resistance.
Confluence of a supply zone and upper trendline, reinforcing its strength.
3. Projected Price Action:
Price may climb back up into the resistance zone.
A rejection is anticipated, leading to another leg down.
The target is around $3,231.11, which matches previous measured moves.
4. Measured Moves (Blue Arrows):
Highlights historical price drops of ~79 points.
Repeating this pattern suggests symmetry and continuation.
5. RSI Indicator:
Currently at 32.88: nearing oversold, but not quite.
No clear bullish divergence, so price could drop further.
---
Trade Idea Summary
Bias: Bearish
Entry Zone: Near $3,300–$3,320 (resistance)
Target: Around $3,231.11
Invalidation: If price breaks and holds above $3,337–$3,340 (EMA 200 and channel breakout)
Mr SMC Trading point
---
Caution/Considerations
Watch for false breakouts above the resistance zone.
Monitor RSI for potential bullish divergence that could invalidate the downside.
Be cautious around the U.S. economic news event icon, which might cause volatility.
plesse support boost 🚀 this analysis)
(Services:✔️ JOIN Telegram channel
#Gold trading ★Analysis★ 📊
Gold trading signals 🚀 99%
t.me/SmcTradingPoin
Join my recommended broker , link 👇
World best broker exness ✅D
one.exnesstrack.org/a/l1t1rf3p6v
#Gold trading ★Analysis★ 📊
Gold trading signals 🚀 99%
t.me/SmcTradingPoin
Join my recommended broker , link 👇
World best broker exness ✅D
one.exnesstrack.org/a/l1t1rf3p6v
Related publications
Disclaimer
The information and publications are not meant to be, and do not constitute, financial, investment, trading, or other types of advice or recommendations supplied or endorsed by TradingView. Read more in the Terms of Use.