Symmetrical Channel Structure and High-Probability Trading Strategies
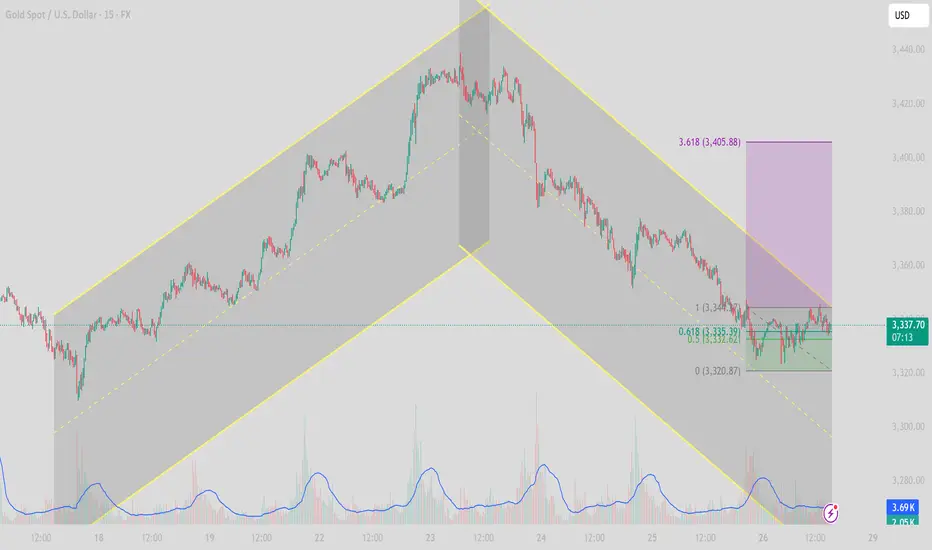
In today’s trading session (July 28), the XAUUSD 15-minute chart reveals a clear symmetrical channel pattern, indicating a technical correction after a previous strong uptrend.
1. Trend Structure
Phase 1 (July 18–23): Price moved within an ascending channel, forming higher highs and higher lows — a clear bullish structure.
Phase 2 (July 23–26): After peaking, price reversed into a descending channel, establishing a bearish sequence of lower highs and lower lows.
Currently, price is consolidating near the lower boundary of the descending channel, testing short-term support.

2. Key Support and Resistance Levels
Price Level
Technical Significance 3,360 – 3,365
Key resistance zone – top of descending channel 3,345
Dynamic resistance – EMA21 on M15 3,320 – 3,315
Crucial support zone – lower boundary of channel 3,300
Psychological support & prior swing low (July 10)
3. Price Action and Indicators
Volume has gradually decreased, signaling potential weakening of selling momentum.
RSI on M15 has rebounded from the oversold zone, currently moving above 40, suggesting a short-term technical bounce.
EMA21 & EMA50 are still sloping downward, confirming short-term bearish pressure.
4. Intraday Trade Scenarios
✅ Scenario 1: Rebound Play from Channel Support
Entry: 3,320 – 3,325 (after bullish confirmation candle)
Stop Loss: Below 3,312
Take Profit: 3,345 – 3,355 (resistance zone & mid-channel)
⚠️ Scenario 2: Trend-Following Short from Resistance
Entry: 3,345 – 3,350 (if price rejects at EMA21 or channel resistance)
Stop Loss: Above 3,360
Take Profit: 3,320 – 3,310
5. Strategy Outlook
XAUUSD remains in a corrective bearish phase after a strong rally. As long as the 3,312 level holds, there’s potential for a technical rebound during the London–New York session. However, sellers remain in control unless price breaks and closes above 3,360.
Follow for more real-time gold strategies. Save this post if you found it helpful!
In today’s trading session (July 28), the XAUUSD 15-minute chart reveals a clear symmetrical channel pattern, indicating a technical correction after a previous strong uptrend.
1. Trend Structure
Phase 1 (July 18–23): Price moved within an ascending channel, forming higher highs and higher lows — a clear bullish structure.
Phase 2 (July 23–26): After peaking, price reversed into a descending channel, establishing a bearish sequence of lower highs and lower lows.
Currently, price is consolidating near the lower boundary of the descending channel, testing short-term support.
2. Key Support and Resistance Levels
Price Level
Technical Significance 3,360 – 3,365
Key resistance zone – top of descending channel 3,345
Dynamic resistance – EMA21 on M15 3,320 – 3,315
Crucial support zone – lower boundary of channel 3,300
Psychological support & prior swing low (July 10)
3. Price Action and Indicators
Volume has gradually decreased, signaling potential weakening of selling momentum.
RSI on M15 has rebounded from the oversold zone, currently moving above 40, suggesting a short-term technical bounce.
EMA21 & EMA50 are still sloping downward, confirming short-term bearish pressure.
4. Intraday Trade Scenarios
✅ Scenario 1: Rebound Play from Channel Support
Entry: 3,320 – 3,325 (after bullish confirmation candle)
Stop Loss: Below 3,312
Take Profit: 3,345 – 3,355 (resistance zone & mid-channel)
⚠️ Scenario 2: Trend-Following Short from Resistance
Entry: 3,345 – 3,350 (if price rejects at EMA21 or channel resistance)
Stop Loss: Above 3,360
Take Profit: 3,320 – 3,310
5. Strategy Outlook
XAUUSD remains in a corrective bearish phase after a strong rally. As long as the 3,312 level holds, there’s potential for a technical rebound during the London–New York session. However, sellers remain in control unless price breaks and closes above 3,360.
Follow for more real-time gold strategies. Save this post if you found it helpful!
🪙 JOIN OUR FREE TELEGRAM GROUP 🪙
t.me/dnaprofits
Join the community group to get support and share knowledge!
️🥇 Exchange and learn market knowledge
️🥇 Support free trading signals
t.me/dnaprofits
Join the community group to get support and share knowledge!
️🥇 Exchange and learn market knowledge
️🥇 Support free trading signals
Related publications
Disclaimer
The information and publications are not meant to be, and do not constitute, financial, investment, trading, or other types of advice or recommendations supplied or endorsed by TradingView. Read more in the Terms of Use.