Technical Breakdown of the Chart
Key Concepts Used:
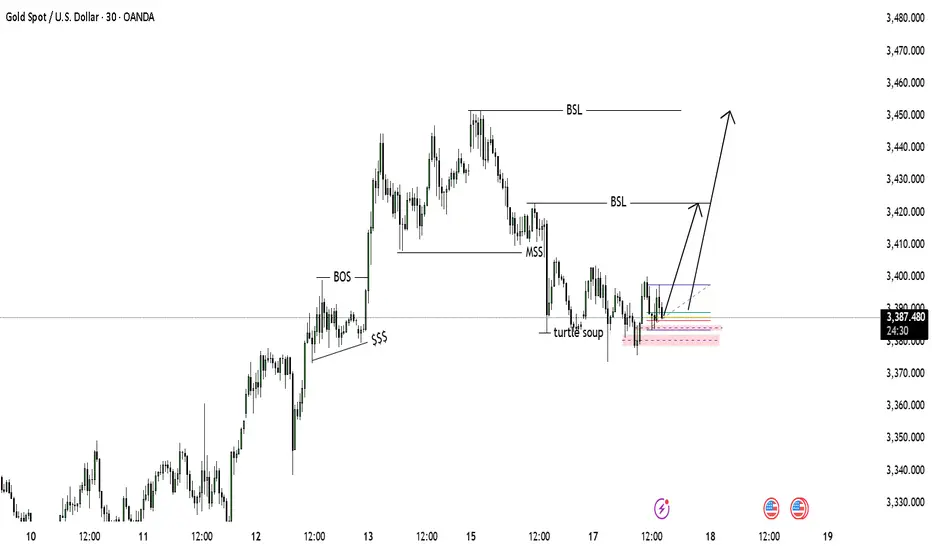
BOS (Break of Structure): Indicates a confirmed bullish break in market structure (around June 13).
MSS (Market Structure Shift): Marks a transition from bullish to bearish structure, which aligns with the swing high on June 14.
BSL (Buy-side Liquidity): Liquidity targets marked above recent highs (~3,420 and ~3,450).
Turtle Soup Setup: A classic fakeout reversal pattern, suggesting a stop-hunt below recent lows before a bullish move.
$$$: Liquidity Pool: Shows accumulation below before a breakout upward.
Bullish Case as Implied by the Chart
The chart suggests:
A liquidity sweep occurred at the recent low ("turtle soup").
Price is now rebounding from a demand zone, supported by bullish order flow.
If structure holds, price may:
Break above the minor high at ~3,410–3,420 (first BSL).
Continue upward toward ~3,450+ (second BSL), potentially reclaiming full bullish momentum.
Key Levels to Watch:
Zone Price Range Type
Demand 3,380–3,388 Support Zone
Target 1 ~3,420 Buy-side Liquidity
Target 2 ~3,450 Final BSL Target
If price breaks below the 3,380 zone with momentum, the bullish thesis weakens.
Summary:
Short-Term Trend: Bullish if support holds.
Liquidity Grab Complete: Signs of a reversal from turtle soup setup.
Upside Targets: 3,420 and 3,450.
Invalidation: Break and close below ~3,380
Key Concepts Used:
BOS (Break of Structure): Indicates a confirmed bullish break in market structure (around June 13).
MSS (Market Structure Shift): Marks a transition from bullish to bearish structure, which aligns with the swing high on June 14.
BSL (Buy-side Liquidity): Liquidity targets marked above recent highs (~3,420 and ~3,450).
Turtle Soup Setup: A classic fakeout reversal pattern, suggesting a stop-hunt below recent lows before a bullish move.
$$$: Liquidity Pool: Shows accumulation below before a breakout upward.
Bullish Case as Implied by the Chart
The chart suggests:
A liquidity sweep occurred at the recent low ("turtle soup").
Price is now rebounding from a demand zone, supported by bullish order flow.
If structure holds, price may:
Break above the minor high at ~3,410–3,420 (first BSL).
Continue upward toward ~3,450+ (second BSL), potentially reclaiming full bullish momentum.
Key Levels to Watch:
Zone Price Range Type
Demand 3,380–3,388 Support Zone
Target 1 ~3,420 Buy-side Liquidity
Target 2 ~3,450 Final BSL Target
If price breaks below the 3,380 zone with momentum, the bullish thesis weakens.
Summary:
Short-Term Trend: Bullish if support holds.
Liquidity Grab Complete: Signs of a reversal from turtle soup setup.
Upside Targets: 3,420 and 3,450.
Invalidation: Break and close below ~3,380
Disclaimer
The information and publications are not meant to be, and do not constitute, financial, investment, trading, or other types of advice or recommendations supplied or endorsed by TradingView. Read more in the Terms of Use.
Disclaimer
The information and publications are not meant to be, and do not constitute, financial, investment, trading, or other types of advice or recommendations supplied or endorsed by TradingView. Read more in the Terms of Use.