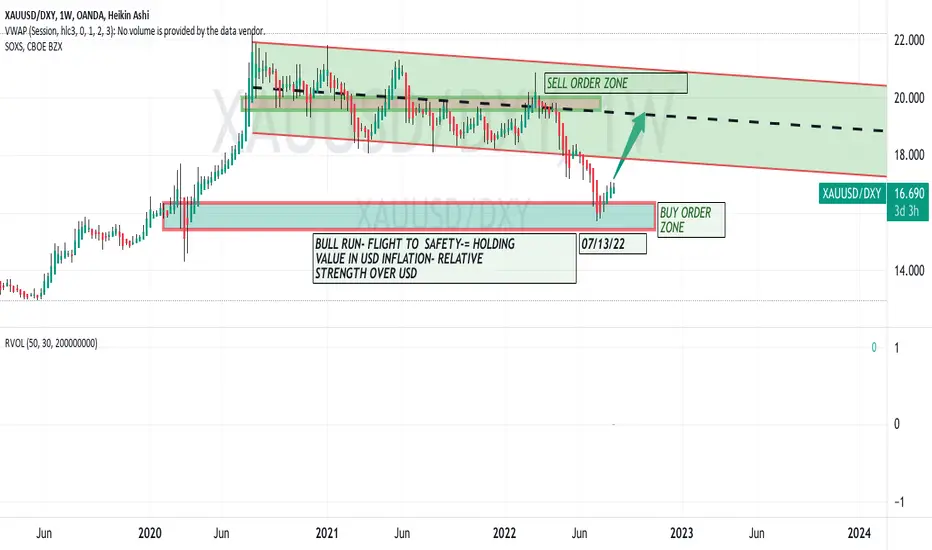
This Weekly Chart shows that the value of gold compared with the  USD is now rising
since July 18th. If over the short term XAUUSD is dropping on a weekly basis it is rising.
This analysis suggests that no matter bearish in the short term, gold is bullish and
potentially a long hard bull run is now underway. See also my idea regarding
a cup and handle pattern for XUAUSD suggesting a price at which spot gold
could break past for the continuation uptrend.
Trade active
XAUUSD makes a Doji candle at support on the 4H chart. Let's go ( especially if day trading on forex)Disclaimer
The information and publications are not meant to be, and do not constitute, financial, investment, trading, or other types of advice or recommendations supplied or endorsed by TradingView. Read more in the Terms of Use.
Disclaimer
The information and publications are not meant to be, and do not constitute, financial, investment, trading, or other types of advice or recommendations supplied or endorsed by TradingView. Read more in the Terms of Use.