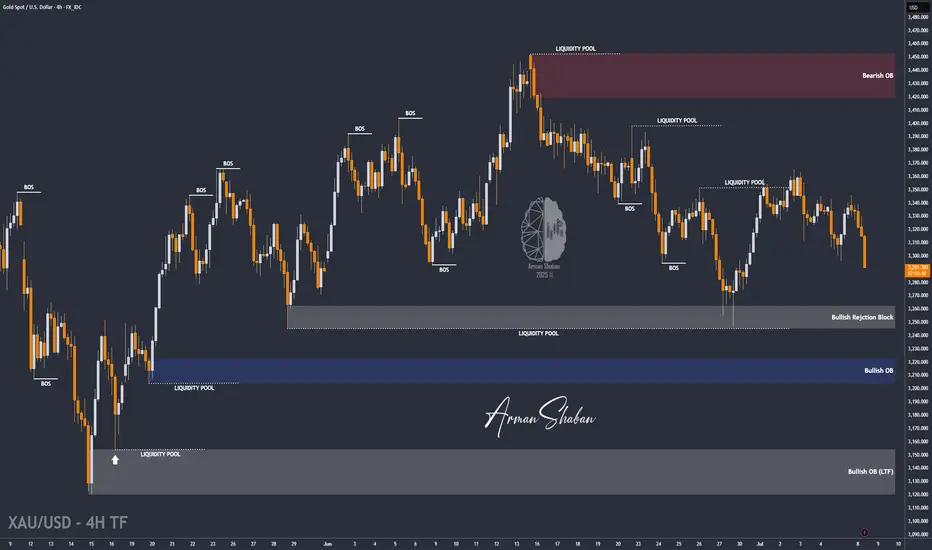
By analyzing the gold chart on the 4-hour timeframe, we can see that, in line with our latest analysis, the bearish momentum has continued—and even more strongly than expected. Gold has broken below the key $3300 level and is currently trading around $3294.
Given the strong momentum, further downside is likely. The next bearish targets are $3289, $3276, $3262, and $3254.
All key supply and demand zones are clearly marked on the chart.
(And if you're looking for more precise trading levels, just drop a comment and I'll guide you.)
Given the strong momentum, further downside is likely. The next bearish targets are $3289, $3276, $3262, and $3254.
All key supply and demand zones are clearly marked on the chart.
(And if you're looking for more precise trading levels, just drop a comment and I'll guide you.)
Note
🎯 Can you predict gold's closing price by the end of this week?If you think you've got the skills, drop your best guess in the comments!
Let’s see who really understands the market dynamics — I’ll be keeping an eye on the closest predictions 👀
Good luck, and let’s engage!
⚜️ Free Telegram Channel : t.me/PriceAction_ICT
⚜️ JOIN THE VIP : t.me/PriceAction_ICT/5946
⚜️ Contact Me : t.me/ArmanShabanTrading
💥Join BitMart Exchange – Ultra Low Fees : bitmart.com/invite/c5JVJK/en-US
⚜️ JOIN THE VIP : t.me/PriceAction_ICT/5946
⚜️ Contact Me : t.me/ArmanShabanTrading
💥Join BitMart Exchange – Ultra Low Fees : bitmart.com/invite/c5JVJK/en-US
Related publications
Disclaimer
The information and publications are not meant to be, and do not constitute, financial, investment, trading, or other types of advice or recommendations supplied or endorsed by TradingView. Read more in the Terms of Use.