Gold technical analysis
Daily chart resistance: 3375, support: 3285
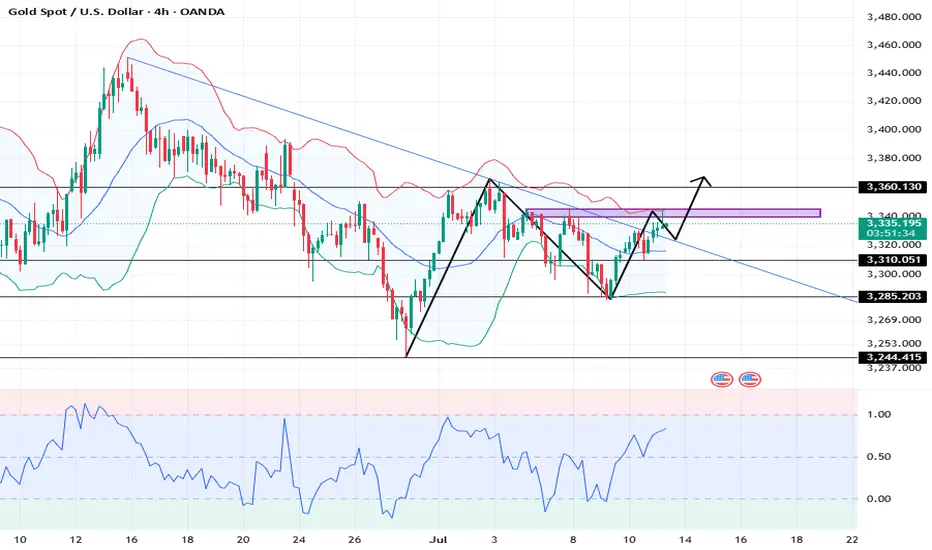
Four-hour chart resistance: 3360, support: 3310
One-hour chart resistance: 3345, support: 3324.
For the current market trend, pay attention to the resistance of 3340-3345 on the upper side during the day. This is the high point concentration area that has suppressed the upward trend of gold prices many times in the early stage. If it is treated as a volatile market, sell at highs in the 3340~3345 range. If it breaks through 3345, it may trigger stop-loss buying and continue to rise to the 3355~3360 area.
The key support below is still at 3310, but from the 1-hour chart, the trend is rising in steps, and the short-term support is around 3324. Buy back here. After the Asian market was blocked near the previous high of 3345, it entered a short-term correction, and the long and short saws. It is suitable for fast in and out, and follow up and buy after breaking through 3345.
Buy: 3324near
Buy: 3310near
Buy: 3345near
Sell: 3344near
Daily chart resistance: 3375, support: 3285
Four-hour chart resistance: 3360, support: 3310
One-hour chart resistance: 3345, support: 3324.
For the current market trend, pay attention to the resistance of 3340-3345 on the upper side during the day. This is the high point concentration area that has suppressed the upward trend of gold prices many times in the early stage. If it is treated as a volatile market, sell at highs in the 3340~3345 range. If it breaks through 3345, it may trigger stop-loss buying and continue to rise to the 3355~3360 area.
The key support below is still at 3310, but from the 1-hour chart, the trend is rising in steps, and the short-term support is around 3324. Buy back here. After the Asian market was blocked near the previous high of 3345, it entered a short-term correction, and the long and short saws. It is suitable for fast in and out, and follow up and buy after breaking through 3345.
Buy: 3324near
Buy: 3310near
Buy: 3345near
Sell: 3344near
💥Telegram Channel Free Updates 👉🏻
💥t.me/Actuary00group
✉️Gold Signal and daily analysis channel
💥t.me/Actuary00group
✉️Gold Signal and daily analysis channel
Disclaimer
The information and publications are not meant to be, and do not constitute, financial, investment, trading, or other types of advice or recommendations supplied or endorsed by TradingView. Read more in the Terms of Use.