Price Structure & Pattern Analysis.
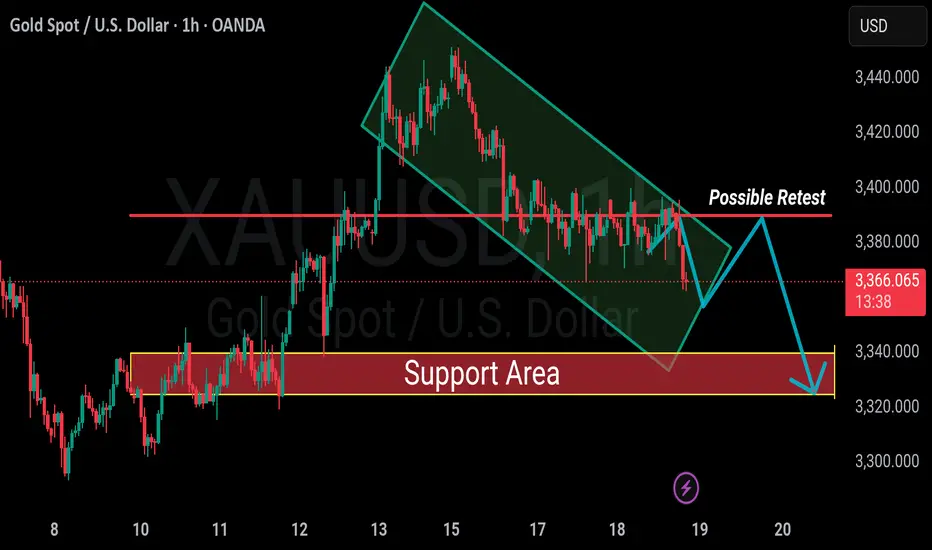
Descending Channel: The price has been trading within a clearly defined bearish channel, marked by lower highs and lower lows.
Breakout & Retest Scenario: The price has broken below the mid-level of the descending channel and is potentially heading for a retest of the previous support (now resistance) zone near $3,375–$3,380, as annotated ("Possible Retest").
Bearish Continuation Expected: A clean rejection at this resistance zone would likely confirm a bearish continuation toward the yellow demand zone around $3,325–$3,335.
---
🔍 Key Support & Resistance Levels
Resistance: ~$3,375–$3,380 (previous support flipped to resistance).
Support/Demand Zone: ~$3,325–$3,335 (multiple reactions, strong buying pressure historically).
---
📊 Indicator Analysis
1. Relative Strength Index (RSI) – [14]
Current Trend: Likely trending toward oversold (<30) during the drop.
Watch for divergence or RSI rising while price makes a lower low (potential bullish divergence).
2. Moving Averages
EMA 50 & EMA 200:
Price is below both EMAs, confirming short-term and long-term bearish bias.
Watch for bearish crossovers or resistance at EMAs during any pullback.
3. Volume Profile
Volume during the last breakdown appears increasing, supporting bearish momentum.
Expect low volume on the retest (if it’s a weak retracement), confirming a potential short entry.
---
📌 Trading Strategy Idea (Educational)
> ⚠️ Not financial advice – for analysis and educational purposes only.
🔻 Bearish Scenario (Primary Bias)
Entry: Near $3,375–$3,380 (possible retest zone).
Stop-Loss: Above channel or prior high (e.g., ~$3,390).
Take-Profit: Around $3,330–$3,325 demand zone.
🔼 Bullish Reversal (Alternate Scenario)
If price breaks above the descending channel and closes above $3,380 with high volume → Possible bullish reversal confirmation.
In that case, watch for a move back toward $3,400–$3,410.
---
📅 Summary
Trend: Bearish (short-term)
Current Price: $3,365.22
Watch Zones:
Resistance: $3,375–$3,380
Support: $3,325–$3,335
Indicators Suggest: Continuation unless strong bullish divergence or breakout above resistance occurs.
Trade active
The Given Idea is Running on its way Just touching Given Retest area around Near 3380 and it is heading to the Bearish momentum till 3350 with Running almost 300+ Pips in Sell wait till Last Target Disclaimer
The information and publications are not meant to be, and do not constitute, financial, investment, trading, or other types of advice or recommendations supplied or endorsed by TradingView. Read more in the Terms of Use.
Disclaimer
The information and publications are not meant to be, and do not constitute, financial, investment, trading, or other types of advice or recommendations supplied or endorsed by TradingView. Read more in the Terms of Use.