Chart Summary
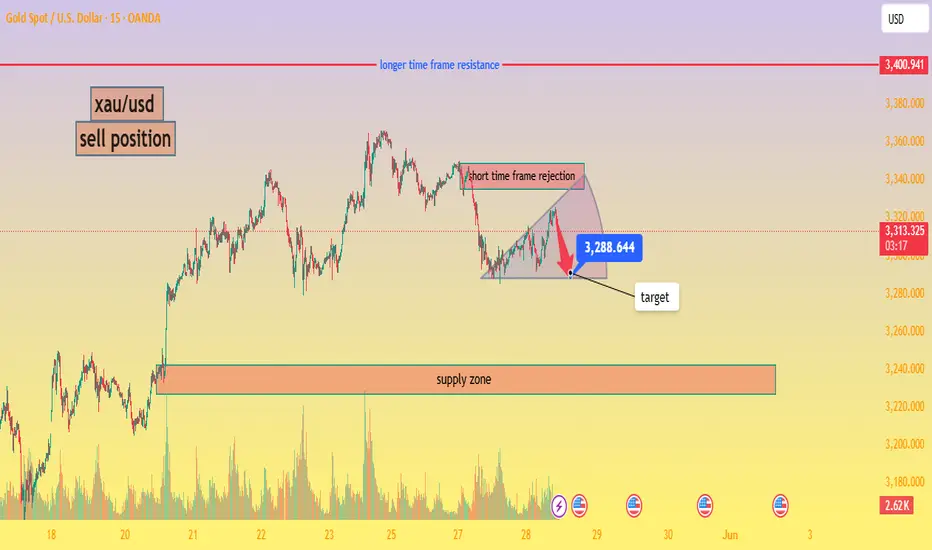
Current Price: ~$3,312.50
Short-term Pattern: Bearish rejection forming a potential downward wave
Key Resistance: ~$3,400 (longer time frame resistance)
Supply Zone: ~$3,230–$3,250
Target Zone: Around $3,288 initially, potentially extended to the supply zone
Analysis
Short Time Frame Rejection: Price attempted to rally but faced strong rejection, forming a lower high. This suggests that bearish pressure is building up.
Bearish Setup: A descending move from the rejection zone aligns with a possible ABC corrective pattern or flag breakdown.
Volume Profile: Higher selling volume near the top hints at distribution.
Trade Plan – Sell Setup
Criteria Details
Entry $3,312–$3,315 (current price area)
Stop Loss Above recent high ~$3,325
Target 1 $3,288
Target 2 $3,240 (supply zone low)
Risk/Reward Approx. 1:2+ depending on exit
Trade Management
If price breaks below $3,288 with momentum, trail stop to breakeven.
Watch for a bounce near $3,250–$3,240 supply zone and reduce position size accordingly.
Avoid new sells if price breaks above $3,325 convincingly, as that may invalidate the setup.
put your valuable comments and support the setup thanks.
Trade active
active fast entry from 3316 sellNote
100+pips running in profitsNote
set breakeven and be risk freeNote
250+ pips booked as market touched 3289Trade closed: target reached
Profit booked almost last target achieved 🎯🎯💯Join My telegram channel Free:
t.me/tamesbulltarder139
💎
VIP Channels:
Forex:+400Pips & Crypto +420% monthly profit at VIP.
check pinned message in telegram for more information.
t.me/tamesbulltarder139
💎
VIP Channels:
Forex:+400Pips & Crypto +420% monthly profit at VIP.
check pinned message in telegram for more information.
Related publications
Disclaimer
The information and publications are not meant to be, and do not constitute, financial, investment, trading, or other types of advice or recommendations supplied or endorsed by TradingView. Read more in the Terms of Use.
Join My telegram channel Free:
t.me/tamesbulltarder139
💎
VIP Channels:
Forex:+400Pips & Crypto +420% monthly profit at VIP.
check pinned message in telegram for more information.
t.me/tamesbulltarder139
💎
VIP Channels:
Forex:+400Pips & Crypto +420% monthly profit at VIP.
check pinned message in telegram for more information.
Related publications
Disclaimer
The information and publications are not meant to be, and do not constitute, financial, investment, trading, or other types of advice or recommendations supplied or endorsed by TradingView. Read more in the Terms of Use.