Gold’s role as a safe haven in times of stress, whether geo-political or tariff related has kept prices riding a rollercoaster up and down between range highs at 3450 and range lows at 3250 since the start of June.
It’s popularity with central banks, led by China, as a diversification asset away from the US dollar has also helped to underpin prices on dips, with the PBOC reporting purchases of the popular metal for 9 straight months in a row.
This week that volatility has continued as prices slipped 2% from opening levels around 3400 on Monday to register a low of 3331 before rebounding back 1% higher again. The reason for the drop, confirmation from President Trump that Gold imports won’t be subject to tariffs, providing clarity to a situation that had caused chaos across global markets into the end of the previous week.
However, looking forward, with Gold currently trading around 3360 again, there are several drivers in play for traders to focus on. The first, is the on-going situation surrounding Federal Reserve (Fed) interest rate cuts. This can be an important consideration given that as a general rule Gold tends to benefit from a lower interest rate environment and vice versa. This is due to it not being an interest-bearing asset when owned.
After an in-line US CPI reading on Tuesday, traders have begun to consider the possibility of a potential jumbo 50bps (0.5%) rate cut when the Fed meet next on September 17th. More impetus has been given to this viewpoint after US Treasury Secretary Scott Bessant stated via Bloomberg TV on Wednesday that he believes US interest rates should be 150-175bps (1.5-1.75%) lower, even adding his weight to the possibility of a 50bps cut in September.
Secondly, President Trump and President Putin meet in Alaska on Friday for a face to face summit to discuss what it would take to achieve an extended ceasefire or even peace in Ukraine. This meeting takes place after a big week of diplomacy from European nations who wanted to make their own viewpoints known, including Ukraine’s unwillingness to give up territory to make a deal happen.
The potential headlines from this meeting, alongside the outcome of today’s US PPI (factory gate inflation) release at 1330 BST could have an influence on the direction of Gold prices into the weekend.
Technical Update: Range Parameters Clearly Set
A sideways range in price action typically forms when there is a balance between both buyers and sellers. Price strength is capped at a level where sellers are found to halt the advance and push prices lower. Price declines are then limited by buyers who provide support at lower levels, leading to a recovery in price. This back-and-forth activity creates a stable range until a breakout occurs.
This would appear to be the current backdrop for Gold

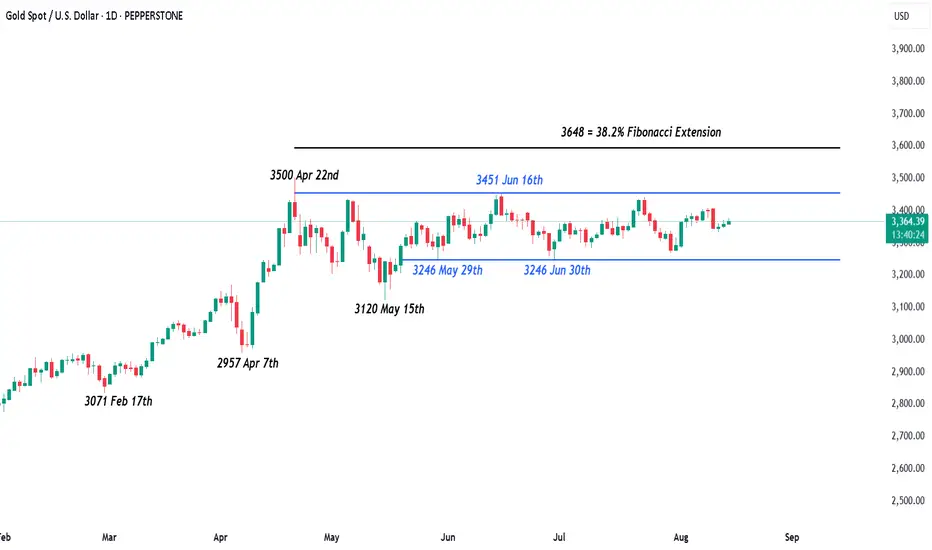
As the chart above shows, recent attempts at Gold price strength have been capped by 3451, which is equal to the June 16th recovery high. This level has limited upward price movement and triggered subsequent weakness. Based on this activity, 3451 possibly represents the upper boundary of Gold’s sideways trading range.
As also shown on the chart above, price weakness has followed the failure to break above the 3451 resistance level. However, buyers have also consistently re-emerged around 3246, which is equal to the May 29th and June 30th price lows, successfully holding declines and triggering a price recovery. This price action suggests 3246 currently marks the lower boundary of Gold’s sideways trading range.
It is impossible to predict when, or even if, a breakout from a sideways range will occur. In the case of Gold, confirmation of a breakout would require a close above the 3451 resistance level, or below the 3246 support. Until then, the range remains intact.
While it does not guarantee a sustained phase of price strength, a successful close above the 3451 resistance level may be viewed by traders as a positive signal for Gold, potentially opening the door for further price strength.
A successful close above the 3451 resistance level could signal a potential move toward 3500, the April 22nd all-time high. If this level is also breached, the next resistance may be 3648, which is equal to the 38.2% Fibonacci extension level.
To the downside, a closing break below the 3246 support, which marks lower limits of the current sideways range, would likely be needed to suggest a break lower from the range.
A successful close below the 3246 support level could lead traders to anticipate further downside risks. If confirmed, this could open the way for a test of 3120, which is equal to the May 15th low support, and potentially extend even further toward 2957, the April 7th low, should that level also be breached.
The material provided here has not been prepared accordance with legal requirements designed to promote the independence of investment research and as such is considered to be a marketing communication. Whilst it is not subject to any prohibition on dealing ahead of the dissemination of investment research, we will not seek to take any advantage before providing it to our clients.
Pepperstone doesn’t represent that the material provided here is accurate, current or complete, and therefore shouldn’t be relied upon as such. The information, whether from a third party or not, isn’t to be considered as a recommendation; or an offer to buy or sell; or the solicitation of an offer to buy or sell any security, financial product or instrument; or to participate in any particular trading strategy. It does not take into account readers’ financial situation or investment objectives. We advise any readers of this content to seek their own advice. Without the approval of Pepperstone, reproduction or redistribution of this information isn’t permitted.
It’s popularity with central banks, led by China, as a diversification asset away from the US dollar has also helped to underpin prices on dips, with the PBOC reporting purchases of the popular metal for 9 straight months in a row.
This week that volatility has continued as prices slipped 2% from opening levels around 3400 on Monday to register a low of 3331 before rebounding back 1% higher again. The reason for the drop, confirmation from President Trump that Gold imports won’t be subject to tariffs, providing clarity to a situation that had caused chaos across global markets into the end of the previous week.
However, looking forward, with Gold currently trading around 3360 again, there are several drivers in play for traders to focus on. The first, is the on-going situation surrounding Federal Reserve (Fed) interest rate cuts. This can be an important consideration given that as a general rule Gold tends to benefit from a lower interest rate environment and vice versa. This is due to it not being an interest-bearing asset when owned.
After an in-line US CPI reading on Tuesday, traders have begun to consider the possibility of a potential jumbo 50bps (0.5%) rate cut when the Fed meet next on September 17th. More impetus has been given to this viewpoint after US Treasury Secretary Scott Bessant stated via Bloomberg TV on Wednesday that he believes US interest rates should be 150-175bps (1.5-1.75%) lower, even adding his weight to the possibility of a 50bps cut in September.
Secondly, President Trump and President Putin meet in Alaska on Friday for a face to face summit to discuss what it would take to achieve an extended ceasefire or even peace in Ukraine. This meeting takes place after a big week of diplomacy from European nations who wanted to make their own viewpoints known, including Ukraine’s unwillingness to give up territory to make a deal happen.
The potential headlines from this meeting, alongside the outcome of today’s US PPI (factory gate inflation) release at 1330 BST could have an influence on the direction of Gold prices into the weekend.
Technical Update: Range Parameters Clearly Set
A sideways range in price action typically forms when there is a balance between both buyers and sellers. Price strength is capped at a level where sellers are found to halt the advance and push prices lower. Price declines are then limited by buyers who provide support at lower levels, leading to a recovery in price. This back-and-forth activity creates a stable range until a breakout occurs.
This would appear to be the current backdrop for Gold
As the chart above shows, recent attempts at Gold price strength have been capped by 3451, which is equal to the June 16th recovery high. This level has limited upward price movement and triggered subsequent weakness. Based on this activity, 3451 possibly represents the upper boundary of Gold’s sideways trading range.
As also shown on the chart above, price weakness has followed the failure to break above the 3451 resistance level. However, buyers have also consistently re-emerged around 3246, which is equal to the May 29th and June 30th price lows, successfully holding declines and triggering a price recovery. This price action suggests 3246 currently marks the lower boundary of Gold’s sideways trading range.
It is impossible to predict when, or even if, a breakout from a sideways range will occur. In the case of Gold, confirmation of a breakout would require a close above the 3451 resistance level, or below the 3246 support. Until then, the range remains intact.
While it does not guarantee a sustained phase of price strength, a successful close above the 3451 resistance level may be viewed by traders as a positive signal for Gold, potentially opening the door for further price strength.
A successful close above the 3451 resistance level could signal a potential move toward 3500, the April 22nd all-time high. If this level is also breached, the next resistance may be 3648, which is equal to the 38.2% Fibonacci extension level.
To the downside, a closing break below the 3246 support, which marks lower limits of the current sideways range, would likely be needed to suggest a break lower from the range.
A successful close below the 3246 support level could lead traders to anticipate further downside risks. If confirmed, this could open the way for a test of 3120, which is equal to the May 15th low support, and potentially extend even further toward 2957, the April 7th low, should that level also be breached.
The material provided here has not been prepared accordance with legal requirements designed to promote the independence of investment research and as such is considered to be a marketing communication. Whilst it is not subject to any prohibition on dealing ahead of the dissemination of investment research, we will not seek to take any advantage before providing it to our clients.
Pepperstone doesn’t represent that the material provided here is accurate, current or complete, and therefore shouldn’t be relied upon as such. The information, whether from a third party or not, isn’t to be considered as a recommendation; or an offer to buy or sell; or the solicitation of an offer to buy or sell any security, financial product or instrument; or to participate in any particular trading strategy. It does not take into account readers’ financial situation or investment objectives. We advise any readers of this content to seek their own advice. Without the approval of Pepperstone, reproduction or redistribution of this information isn’t permitted.
Global risk Warning CFDs are complex instruments and come with a high risk of losing money rapidly due to leverage. Between 74-89% of retail investor accounts lose money when trading in CFDs. You should consider whether you understand how CFD
Disclaimer
The information and publications are not meant to be, and do not constitute, financial, investment, trading, or other types of advice or recommendations supplied or endorsed by TradingView. Read more in the Terms of Use.