Market news:
In the early Asian session on Monday (June 9), spot gold opened high and fell, currently trading around $3,305/ounce. The large-scale riots in Los Angeles, the United States, attracted some safe-haven buying to support the London gold price. The stronger-than-expected US employment report hit the Federal Reserve's hopes of cutting interest rates this year, and silver once surged to its highest level since 2012. Data from the US Department of Labor showed that employers added 139,000 jobs in May, less than 147,000 in April, but more than the 130,000 increase predicted by a survey of economists. After the data was released, the financial market bet that the Federal Reserve would not cut interest rates until September, and the probability of a rate cut in September dropped from 88% to 60%. There will be two rate cuts in 2025, reducing bets on a possible third rate cut.In the next week, the market will usher in major trade negotiations and heavyweight US CPI data, which investors need to pay close attention to. In addition, US federal law enforcement officers continued to search for illegal immigrants in many places in Los Angeles County on the 7th, and had serious conflicts with local community residents for the second consecutive day. Investors also need to pay attention to the impact of market sentiment.
Technical Review:
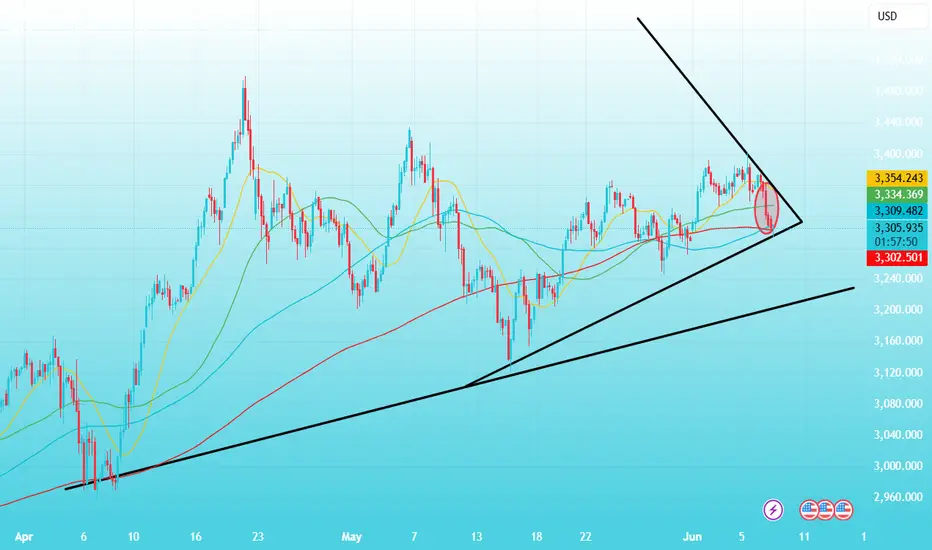
Technically, gold plunged sharply after midnight on Friday, and the weekly line closed with a long upper shadow line and a small positive. The 3400 mark encountered resistance and fell sharply and fell into another adjustment cycle. The daily line closed with a continuous negative structure, and the New York closing price once again lost the MA10-day moving average of 3330. The price returned to the middle track of the Bollinger band at 3310, and the RSI indicator's central axis 50 value flattened! The short-term four-hour chart MA10/7-day moving average opened downward, the RSI indicator's central axis 50 value ran below, and the Bollinger band opened downward and the price ran along the middle and lower tracks. At the beginning of the week, trading focused on the rebound strength after the oversold. The main idea was to sell at a high price on the rebound, and to buy at a low price as an auxiliary.
Today's analysis:
At the daily level, the price of gold has maintained a volatile pattern in recent times. The Bollinger band opening narrowed, indicating that the buying and selling forces were stalemate. MACD fast and slow lines are above the zero axis, the spacing is narrowing and there is a golden cross trend, the red kinetic energy column is beginning to appear, the buying power is slowly gathering, the RSI indicator is around 55, and the buying and selling game is fierce! From the hourly line, the Bollinger Bands open downward, and selling is temporarily dominant.MACD dead cross operation, the green kinetic energy column continues to increase, the 5-day moving average crosses the 10-day moving average, and the short-term downward trend is obvious. However, the current support near 3300 is strong, and it rebounded after multiple dips. In the future, we need to pay attention to the breakthrough of key positions to grasp the trading opportunity.
Operation ideas:
Short-term gold 3283-3286 buy, stop loss 3275, target 3310-3330;
Short-term gold 3330-3333 sell, stop loss 3342, target 3290-3270;
Key points:
First support level: 3293, second support level: 3271, third support level: 3253
First resistance level: 3330, second resistance level: 3356, third resistance level: 3378
In the early Asian session on Monday (June 9), spot gold opened high and fell, currently trading around $3,305/ounce. The large-scale riots in Los Angeles, the United States, attracted some safe-haven buying to support the London gold price. The stronger-than-expected US employment report hit the Federal Reserve's hopes of cutting interest rates this year, and silver once surged to its highest level since 2012. Data from the US Department of Labor showed that employers added 139,000 jobs in May, less than 147,000 in April, but more than the 130,000 increase predicted by a survey of economists. After the data was released, the financial market bet that the Federal Reserve would not cut interest rates until September, and the probability of a rate cut in September dropped from 88% to 60%. There will be two rate cuts in 2025, reducing bets on a possible third rate cut.In the next week, the market will usher in major trade negotiations and heavyweight US CPI data, which investors need to pay close attention to. In addition, US federal law enforcement officers continued to search for illegal immigrants in many places in Los Angeles County on the 7th, and had serious conflicts with local community residents for the second consecutive day. Investors also need to pay attention to the impact of market sentiment.
Technical Review:
Technically, gold plunged sharply after midnight on Friday, and the weekly line closed with a long upper shadow line and a small positive. The 3400 mark encountered resistance and fell sharply and fell into another adjustment cycle. The daily line closed with a continuous negative structure, and the New York closing price once again lost the MA10-day moving average of 3330. The price returned to the middle track of the Bollinger band at 3310, and the RSI indicator's central axis 50 value flattened! The short-term four-hour chart MA10/7-day moving average opened downward, the RSI indicator's central axis 50 value ran below, and the Bollinger band opened downward and the price ran along the middle and lower tracks. At the beginning of the week, trading focused on the rebound strength after the oversold. The main idea was to sell at a high price on the rebound, and to buy at a low price as an auxiliary.
Today's analysis:
At the daily level, the price of gold has maintained a volatile pattern in recent times. The Bollinger band opening narrowed, indicating that the buying and selling forces were stalemate. MACD fast and slow lines are above the zero axis, the spacing is narrowing and there is a golden cross trend, the red kinetic energy column is beginning to appear, the buying power is slowly gathering, the RSI indicator is around 55, and the buying and selling game is fierce! From the hourly line, the Bollinger Bands open downward, and selling is temporarily dominant.MACD dead cross operation, the green kinetic energy column continues to increase, the 5-day moving average crosses the 10-day moving average, and the short-term downward trend is obvious. However, the current support near 3300 is strong, and it rebounded after multiple dips. In the future, we need to pay attention to the breakthrough of key positions to grasp the trading opportunity.
Operation ideas:
Short-term gold 3283-3286 buy, stop loss 3275, target 3310-3330;
Short-term gold 3330-3333 sell, stop loss 3342, target 3290-3270;
Key points:
First support level: 3293, second support level: 3271, third support level: 3253
First resistance level: 3330, second resistance level: 3356, third resistance level: 3378
Related publications
Disclaimer
The information and publications are not meant to be, and do not constitute, financial, investment, trading, or other types of advice or recommendations supplied or endorsed by TradingView. Read more in the Terms of Use.
Related publications
Disclaimer
The information and publications are not meant to be, and do not constitute, financial, investment, trading, or other types of advice or recommendations supplied or endorsed by TradingView. Read more in the Terms of Use.