🔍 Overview of the Chart & Market Context
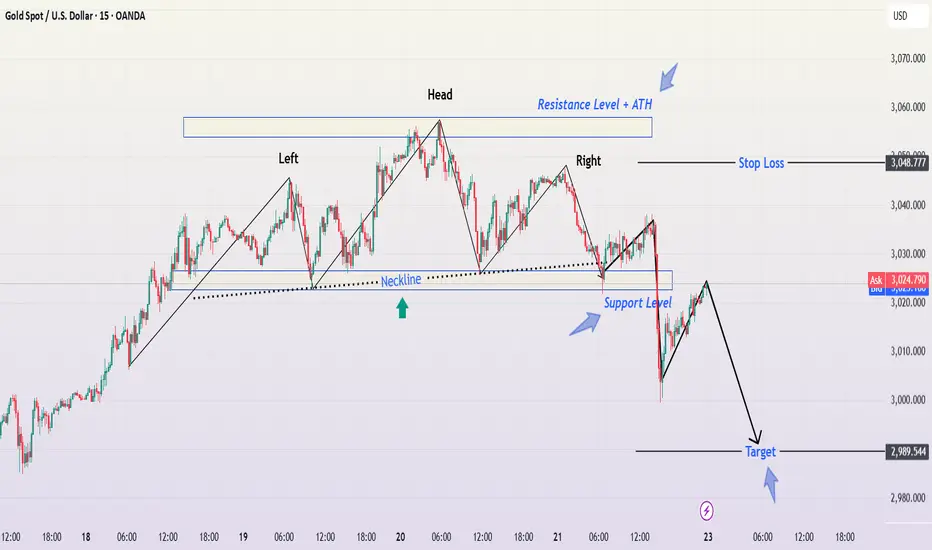
This 15-minute Gold Spot (XAU/USD) chart shows the formation of a classic Head & Shoulders (H&S) pattern, signaling a potential trend reversal from bullish to bearish. This pattern often indicates that buying momentum is weakening, and a significant price decline may follow.
Gold has been in a strong uptrend before forming this structure. However, after reaching a resistance zone at an all-time high (ATH), the market has failed to sustain its bullish momentum. The rejection from this level and the break of the neckline (support level) suggest that sellers are gaining control, leading to a potential bearish breakdown toward the downside target.
This setup provides a high-probability shorting opportunity if price action follows through with the bearish structure. Let’s analyze the different elements in detail.
📊 Understanding the Head & Shoulders Pattern in Detail
The Head & Shoulders is a well-known reversal pattern, and in this case, it forms at the top of an uptrend, indicating a shift in market sentiment. The key components of this pattern in the chart are:
1️⃣ Left Shoulder
Price made an initial rally, then faced rejection at a resistance level.
A retracement occurred, forming a swing low, which became part of the neckline support.
2️⃣ Head
Buyers attempted another push, creating a higher high.
However, the rally was unsustainable, as sellers pushed the price back down toward the neckline.
This forms the peak of the structure, marking the highest point before the reversal.
3️⃣ Right Shoulder
Another rally followed, but this time, buyers lacked strength.
The price failed to break the previous high (head level) and reversed downward.
This indicated that selling pressure was increasing, forming the right shoulder.
4️⃣ Neckline (Support Level)
This is the most critical level in this setup.
It connects the swing lows between the left shoulder and right shoulder.
Once the price breaks below this trendline support, the pattern is confirmed, triggering a bearish move.
📌 Key Technical Levels Identified
🔵 Resistance Level (+ ATH – All-Time High)
The blue box represents the strong resistance zone where gold faced rejection multiple times.
This level acted as a supply zone, preventing further bullish continuation.
📉 Neckline & Support Level
This trendline support (dotted black line) connected the lows between the left and right shoulders.
A clean break and retest of this level signal further downside movement.
🚨 Stop Loss Level ($3,048.777)
The ideal stop-loss placement is above the right shoulder to prevent getting stopped out by market noise.
If the price reclaims this level, it could invalidate the bearish thesis.
🎯 Target Level ($2,989.544)
The target is based on the measured move, calculated by taking the height from the head to the neckline and projecting it downward.
If the breakdown plays out successfully, we could see a move toward $2,989.544 or even lower.
📉 Trading Plan: Bearish Trade Setup
🔴 Short Trade Entry
Sell Entry: On the break & retest of the neckline (support turning into resistance).
Confirmation: A strong bearish candlestick (e.g., engulfing pattern) below the neckline.
🚨 Stop Loss (Risk Management)
SL Placement: Above the right shoulder ($3,048.777) to prevent false breakouts.
Reason: If price moves above this level, the pattern gets invalidated.
🎯 Profit Target (Take Profit)
Target Level: $2,989.544, based on the measured move.
Risk-to-Reward (RR) Ratio: Aiming for at least a 1:2 RR ratio, ensuring a profitable setup.
📌 Confirmation Signals for Stronger Conviction
For higher probability, traders should look for additional confirmations before entering the short position:
✔ Neckline Retest: After breaking below the neckline, price retests it as resistance before dropping further.
✔ Bearish Candlestick Pattern: Engulfing candles, shooting stars, or rejection wicks indicate strong selling pressure.
✔ Increased Volume on Breakdown: A spike in volume on the breakdown confirms strong market participation.
✔ RSI Divergence: A bearish divergence between price and RSI may signal trend exhaustion.
📉 Expected Price Action: What’s Next?
Based on this setup, if the bearish structure plays out as expected:
1️⃣ Price will retest the neckline as new resistance.
2️⃣ Sellers will step in, pushing the price lower.
3️⃣ Gold will continue downward toward the $2,989 support level.
4️⃣ If strong selling continues, price may drop even further beyond the target zone.
However, if price closes back above the right shoulder, the bearish setup gets invalidated, and traders should exit the short position immediately.
📌 Final Thoughts & Summary
Pattern Identified: Head & Shoulders (Bearish Reversal)
Market Bias: Bearish
Entry Trigger: Break & retest of the neckline
Stop-Loss Placement: Above the right shoulder ($3,048)
Take-Profit Target: $2,989
Risk Management: Ensure a minimum 1:2 RR ratio
📉 Conclusion:
Gold is showing signs of bearish exhaustion after forming a Head & Shoulders pattern. A confirmed break below the neckline suggests that the price may continue its downward trajectory. Traders should wait for a proper retest before entering, use strict risk management, and monitor key technical indicators for confirmation.
Would you like me to provide an alternative trading plan if the price reverses? 🚀
For Daily Trade Setups and Forecast: 📈 t.me/xauusdoptimizer
Premium Signals Fr33: 💯 t.me/xauusdoptimizer
🥰🥳🤩
Premium Signals Fr33: 💯 t.me/xauusdoptimizer
🥰🥳🤩
Related publications
Disclaimer
The information and publications are not meant to be, and do not constitute, financial, investment, trading, or other types of advice or recommendations supplied or endorsed by TradingView. Read more in the Terms of Use.