Hey everyone! Today,
we're diving deep into XAUUSD (Gold) using a daily candle tape reading approach that aims to uncover critical turning points and price levels. If you're looking for an edge in understanding Gold's movements, this analysis could be a game-changer.
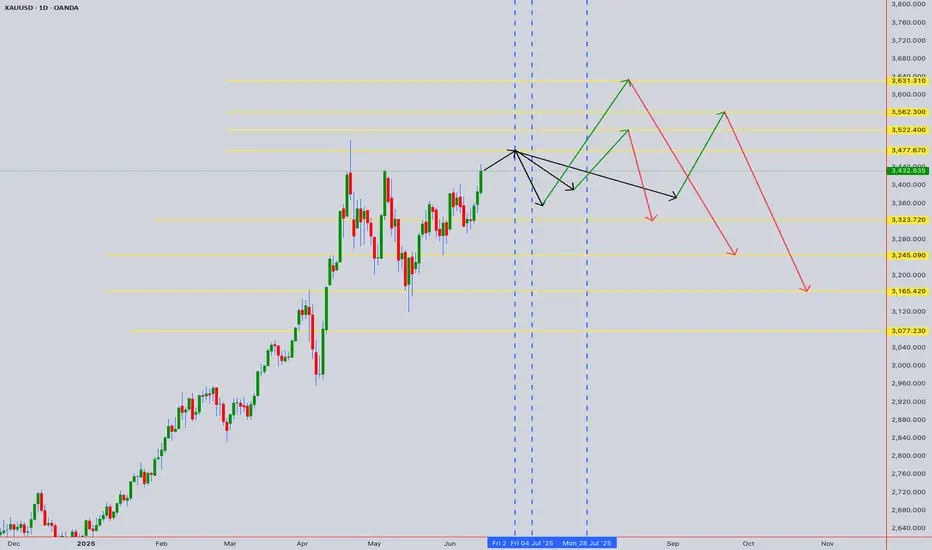
On the accompanying chart, you'll see yellow horizontal lines that highlight key bullish and bearish price levels. These aren't just arbitrary lines; they represent significant battlegrounds where buyers and sellers have historically shown their hand.
In addition, the vertical lines on the chart pinpoint specific days where we've observed a change in trade direction or a potential reversal. It's important to note that these shifts can sometimes occur within one or two candles before or after the marked day, so keep an eye on the immediate vicinity.
We're interpreting these price levels with a 3% to 5% tolerance, allowing for the natural ebb and flow of the market around these crucial points.
Key Price Levels to Watch:
Bullish Price Levels:
3477.67: A critical zone where bullish momentum has historically taken hold.
3522.40: Another strong support level that could propel Gold higher.
3562.30: Watch this level for signs of continued upward pressure.
3631.31: A significant resistance-turned-support level that could signal a strong bullish continuation.
Bearish Price Levels:
3323.72: A key level where bearish pressure has often intensified.
3245.09: If this level breaks, it could indicate further downside for Gold.
3165.42: A crucial support level; a breach here could accelerate a downtrend.
3077.23: The ultimate test for the bears; a break below could signal a more substantial correction.
__________________________________________________________________________________
What are your thoughts on these levels? Have you noticed similar patterns in your own XAUUSD analysis? Share your insights in the comments below!
⚠️ Disclaimer: This post is educational content and does not constitute investment advice, financial advice, or trading recommendations. The views expressed here are based on technical analysis and are shared solely for informational purposes. The stock market is subject to risks, including capital loss, and readers should exercise due diligence before investing. We do not take responsibility for decisions made based on this content. Consult a certified financial advisor for personalized guidance
we're diving deep into XAUUSD (Gold) using a daily candle tape reading approach that aims to uncover critical turning points and price levels. If you're looking for an edge in understanding Gold's movements, this analysis could be a game-changer.
On the accompanying chart, you'll see yellow horizontal lines that highlight key bullish and bearish price levels. These aren't just arbitrary lines; they represent significant battlegrounds where buyers and sellers have historically shown their hand.
In addition, the vertical lines on the chart pinpoint specific days where we've observed a change in trade direction or a potential reversal. It's important to note that these shifts can sometimes occur within one or two candles before or after the marked day, so keep an eye on the immediate vicinity.
We're interpreting these price levels with a 3% to 5% tolerance, allowing for the natural ebb and flow of the market around these crucial points.
Key Price Levels to Watch:
Bullish Price Levels:
3477.67: A critical zone where bullish momentum has historically taken hold.
3522.40: Another strong support level that could propel Gold higher.
3562.30: Watch this level for signs of continued upward pressure.
3631.31: A significant resistance-turned-support level that could signal a strong bullish continuation.
Bearish Price Levels:
3323.72: A key level where bearish pressure has often intensified.
3245.09: If this level breaks, it could indicate further downside for Gold.
3165.42: A crucial support level; a breach here could accelerate a downtrend.
3077.23: The ultimate test for the bears; a break below could signal a more substantial correction.
__________________________________________________________________________________
What are your thoughts on these levels? Have you noticed similar patterns in your own XAUUSD analysis? Share your insights in the comments below!
⚠️ Disclaimer: This post is educational content and does not constitute investment advice, financial advice, or trading recommendations. The views expressed here are based on technical analysis and are shared solely for informational purposes. The stock market is subject to risks, including capital loss, and readers should exercise due diligence before investing. We do not take responsibility for decisions made based on this content. Consult a certified financial advisor for personalized guidance
Disclaimer
The information and publications are not meant to be, and do not constitute, financial, investment, trading, or other types of advice or recommendations supplied or endorsed by TradingView. Read more in the Terms of Use.
Disclaimer
The information and publications are not meant to be, and do not constitute, financial, investment, trading, or other types of advice or recommendations supplied or endorsed by TradingView. Read more in the Terms of Use.