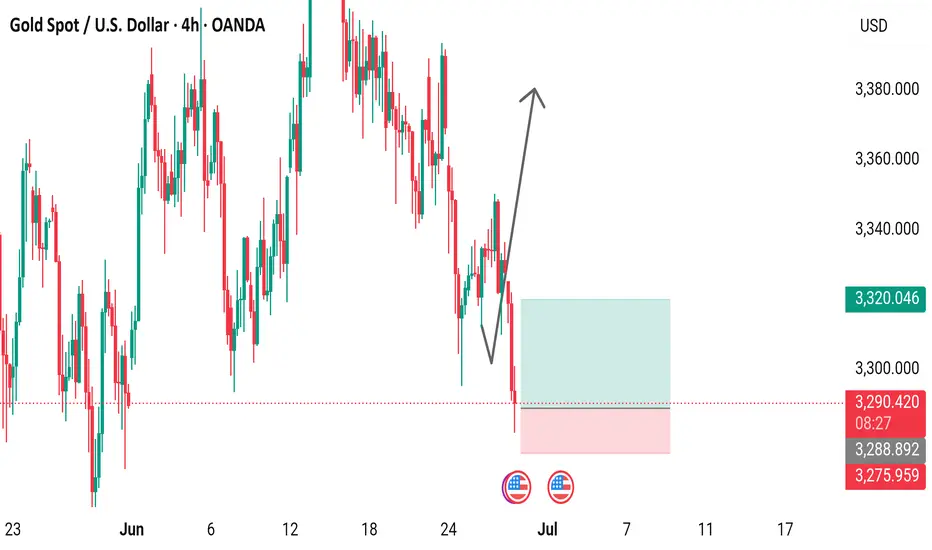
4-hour chart from OANDA displays the price movement of Gold Spot (XAU/USD) from late June to mid-July 2025. The current price is $3,290.270, reflecting a decrease of $37.475 (-1.13%) as of 09:42. The chart highlights a recent upward trend followed by a potential support zone around $3,200-$3,300, with a marked resistance level near $3,380. The analysis suggests a possible reversal or consolidation phase.
Disclaimer
The information and publications are not meant to be, and do not constitute, financial, investment, trading, or other types of advice or recommendations supplied or endorsed by TradingView. Read more in the Terms of Use.
Disclaimer
The information and publications are not meant to be, and do not constitute, financial, investment, trading, or other types of advice or recommendations supplied or endorsed by TradingView. Read more in the Terms of Use.