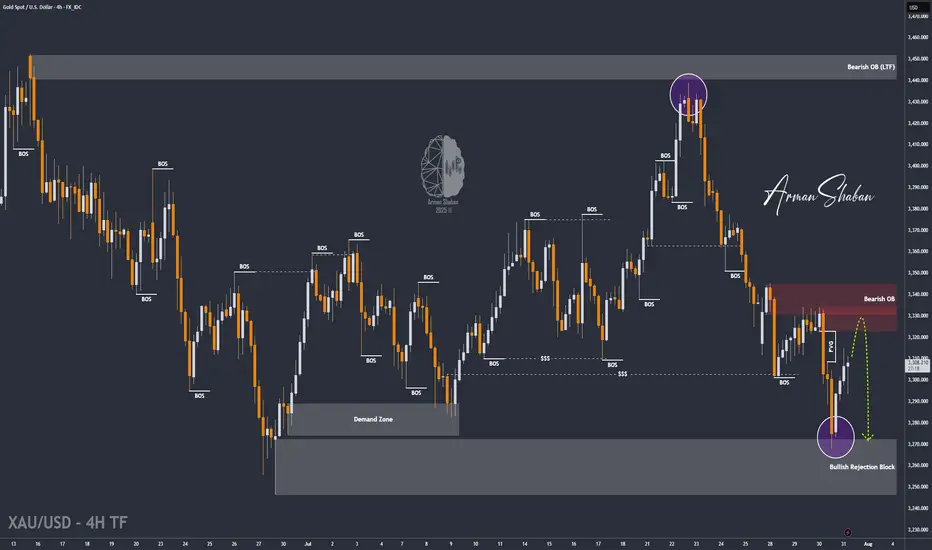
By analyzing the gold chart on the 4-hour timeframe, we can see that, just as expected, the price dropped from $3310 to $3288 in the first leg, where it hit a demand zone and bounced up to $3305, delivering a 170-pip rally. The main bearish move from $3333 to $3288 yielded 450 pips, bringing the total return on this analysis to over 620 pips!
In the second phase, gold dropped sharply again to $3268, and once more found demand, currently trading around $3307. If the price holds above $3294, we could expect further upside toward the $3322–$3334 zone. Once gold reaches this area, a strong bearish rejection is likely, with a potential return of 250 to 400 pips.
All key supply and demand levels are marked on the chart — make sure to monitor them closely and study the chart in detail. Hope you’ve made the most of this powerful analysis!
Please support me with your likes and comments to motivate me to share more analysis with you and share your opinion about the possible trend of this chart with me !
Best Regards , Arman Shaban
Trade active
By analyzing the gold chart on the 4-hour timeframe, we can see that the bearish move started earlier than expected. After breaking below the $3294 level, gold extended its decline and is currently trading around $3290. If the price closes below $3289, we could see further downside correction.The key supply zone remains between $3322–$3334, while the key demand zone is between $3266–$3276 — make sure to watch price reactions around these levels closely.
In the mid-term, if gold fails to reclaim $3300, a deeper drop toward $3246 becomes likely as the next bearish target.
🔥 And hey friends, smash that like button — tomorrow I’ll be dropping a fresh gold analysis you won’t want to miss! Good night! ❤️
Trade closed manually
By analyzing the gold chart on the 4-hour timeframe, we can see that earlier today, after dropping to $3281, gold managed to climb back above $3300. Following the revised U.S. NFP data, a strong bullish rally pushed the price up to $3355, where it met a key bearish breaker block and began a slight correction. It’s currently trading around $3346.So far, there are no clear signs of a strong reversal, and in my opinion, opening SHORT positions here is quite risky under current conditions. I recommend focusing only on major levels like $3371, $3385, and $3398 for potential setups. Key demand zones to watch are $3311, $3301, $3293, and $3286.
⚜️ Free Telegram Channel : t.me/PriceAction_ICT
⚜️ JOIN THE VIP : t.me/PriceAction_ICT/5946
⚜️ Contact Me : t.me/ArmanShabanTrading
💥Join BitMart Exchange – Ultra Low Fees : bitmart.com/invite/c5JVJK/en-US
⚜️ JOIN THE VIP : t.me/PriceAction_ICT/5946
⚜️ Contact Me : t.me/ArmanShabanTrading
💥Join BitMart Exchange – Ultra Low Fees : bitmart.com/invite/c5JVJK/en-US
Related publications
Disclaimer
The information and publications are not meant to be, and do not constitute, financial, investment, trading, or other types of advice or recommendations supplied or endorsed by TradingView. Read more in the Terms of Use.