Gold Market Daily Timeframe Analysis
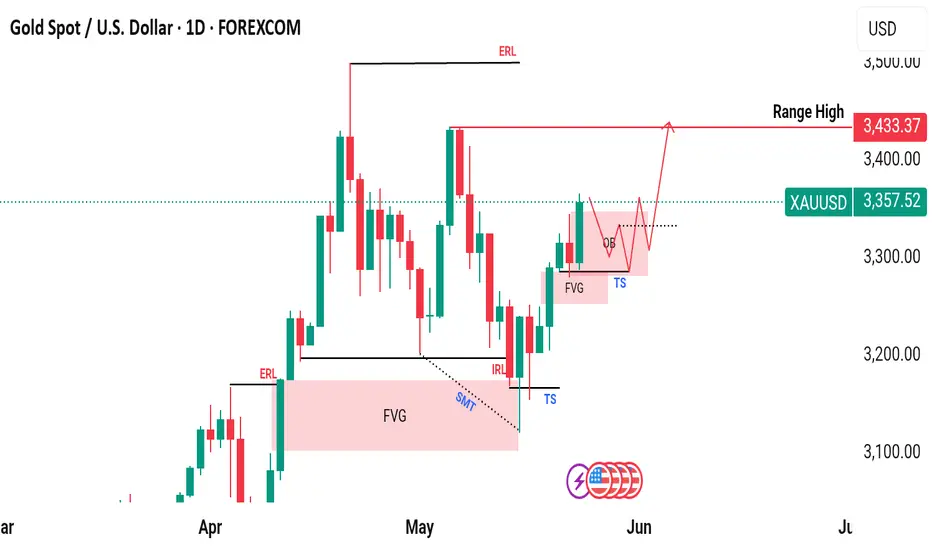
The gold market, on the daily timeframe, is currently exhibiting price action consistent with an IRL (Internal Range Liquidity) to ERL (External Range Liquidity) model. Price has swept the IRL and then moved upward by tapping into a Fair Value Gap (FVG). This price action suggests a smart money liquidity grab followed by a reaction to an imbalance.
Subsequently, the market formed another FVG and executed a tap once more after taking out the initial target structure (TS), continuing its bullish move. Recently, we’ve observed the formation of an Order Block (OB), indicating a potential area where institutional orders may reside.
It’s expected that price might return to this OB, and if a Market Structure Shift (MSS) is confirmed on lower timeframes, there could be a strong bullish continuation. In such a case, we may witness the market reaching towards the $3430 level in the coming days.
It’s essential to monitor how the market reacts to these key zones especially the OB and the surrounding liquidity structures. Such movements could provide confirmation or invalidation of the projected move.
As always, this is a personal market perspective based on price action and liquidity concepts. Please conduct your own research (DYOR). This is not financial advice.
And by the way what are your thoughts on this analysis? Does it align with your outlook?
Join My Telegram Channel For Getting Free Signals and Analysis 👇👇
t.me/fxinsighthub7
t.me/fxinsighthub7
Disclaimer
The information and publications are not meant to be, and do not constitute, financial, investment, trading, or other types of advice or recommendations supplied or endorsed by TradingView. Read more in the Terms of Use.