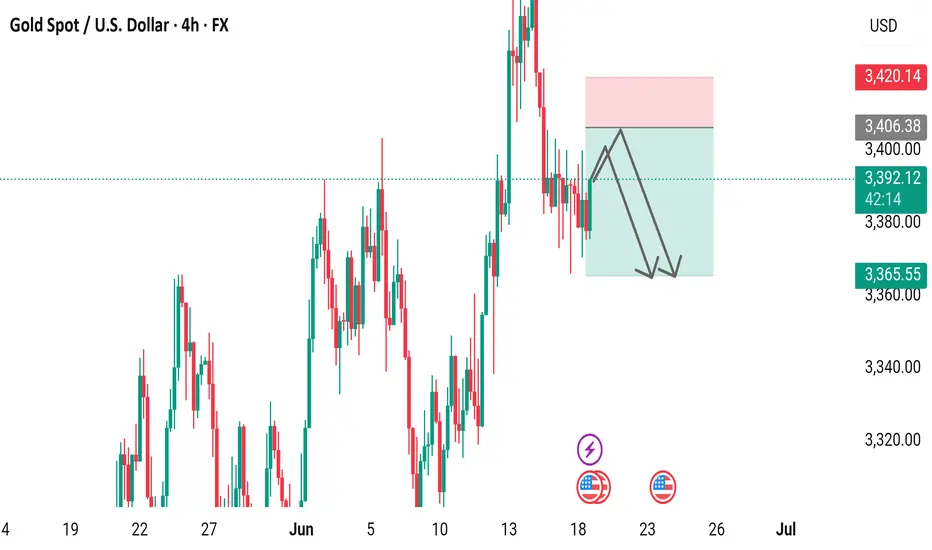
4-hour candlestick chart displays the price movement of Gold Spot (XAU) against the U.S. Dollar (USD) from June 4 to June 18, 2025. The current price is 3,391.79, reflecting a +3.61 (+0.11%) change. The chart highlights a recent upward trend with a notable peak, followed by a slight pullback. Key price levels are marked, ranging from 3,320.00 to 3,420.14, with technical analysis indicators such as a resistance zone (pink) and a support zone (light green) overlaid.
Trade closed: target reached
Target achieved on $3372 no one can beat my direction if want hold as your wish guy's but I'll close my tradesDaily XAU/USD FREE setups | Let's grow together!
| XAU/USD Trader | Telegram: https://t.me/Aleegoldsignals
| XAU/USD Trader | Telegram: https://t.me/Aleegoldsignals
Disclaimer
The information and publications are not meant to be, and do not constitute, financial, investment, trading, or other types of advice or recommendations supplied or endorsed by TradingView. Read more in the Terms of Use.
Daily XAU/USD FREE setups | Let's grow together!
| XAU/USD Trader | Telegram: https://t.me/Aleegoldsignals
| XAU/USD Trader | Telegram: https://t.me/Aleegoldsignals
Disclaimer
The information and publications are not meant to be, and do not constitute, financial, investment, trading, or other types of advice or recommendations supplied or endorsed by TradingView. Read more in the Terms of Use.